To view, share or print a PDF version of the report, click Download.
For more information about the report, email press@zillow.com.
Contents
Foreword
For more than a decade, Zillow® has been helping millions of Americans do their homework. Our users have trusted us when it was time to make life’s biggest financial decisions: finding a great apartment, buying a first home or downsizing later in life.
We are probably best known for tracking the value of 110 million homes with the Zestimate®, and we’ve always done research into Americans and their homes. Our company, now called Zillow Group, came of age during a time of huge change in the way consumers interact and make decisions, as an increasing amount of our lives are lived online, and computers have gone from desktops to pockets. Today’s youngest homeowners have never known a world without the internet.
That’s why we decided it was time to embark on the most comprehensive research ever done about home buyers, sellers, owners and renters. The Zillow Group Report on Consumer Housing Trends is our homework—a deep report on all the people for whom Zillow has become such an important touchpoint.
We were curious about how buyers and sellers approached decisions and making deals, but we also wanted to know about homeowners and their approach to everything from finding a lender to remodeling the kitchen. Finally, we wanted to survey renters—who are an increasingly large demographic and likely tomorrow’s buyers.
To accomplish this ambitious goal, we surveyed an unbiased sample of more than 13,000 homeowners, sellers, buyers and renters. The results paint a rich picture of all the people involved in the process of deciding where to live—a younger and more diverse group than many appreciate.
Half of all buyers are under age 36, meaning the Millennial generation is driving more of the housing market than we previously understood.
We also discovered that buyers aren’t replacing the expertise of real estate agents with online research—but they are doing a tremendous amount of research online before contacting an agent. Those who start their home searches online are actually more likely to use an agent than other buyers.
We asked families with kids about their finances and found they are scraping together down payments from savings, gifts and retirement funds to buy bigger homes, and then borrowing money to renovate and make repairs.
And we learned about priorities: For more than a third of renters, finding a place that will allow their pets is paramount—often cited as more important than a shorter commute.
This Zillow Group Report sheds light on large demographic trends, brings context to the conversations happening around kitchen tables across the country, and adds value to our partnerships with the country’s most savvy real estate agents and organizations. These insights are critical to our mission of empowering customers to make smarter, more informed decisions about their homes. It’s something we call “turning on the lights” and it means our users are more able to make good decisions if they have all the information we can possibly give them.
If you’re a real estate or rental professional, you’ll find rich insights to help build your business and serve your customers. If you’re a journalist or a researcher, there is plenty of fodder here to track economic and social trends.
And if you’re a buyer, seller, homeowner or renter hungry for information, I’m honored to have your trust as you find your way home. Enjoy the first annual Zillow Group Report on Consumer Housing Trends.
Stan Humphries, Ph.D.
Chief Analytics Officer and Chief Economist, Zillow Group
@stanhumphries
Methodology
Research Approach | In order to gain a comprehensive understanding of the United States residential real estate market, Zillow Group employed independent market research firm Lieberman Research Worldwide® to conduct a nationally representative, online quantitative survey. The blinded, self-administered study was fielded between April 27 and May 12, 2016.
Completes & Qualifications | This 160-question survey gathered information from a total of 13,249 consumers among the following consumer populations:
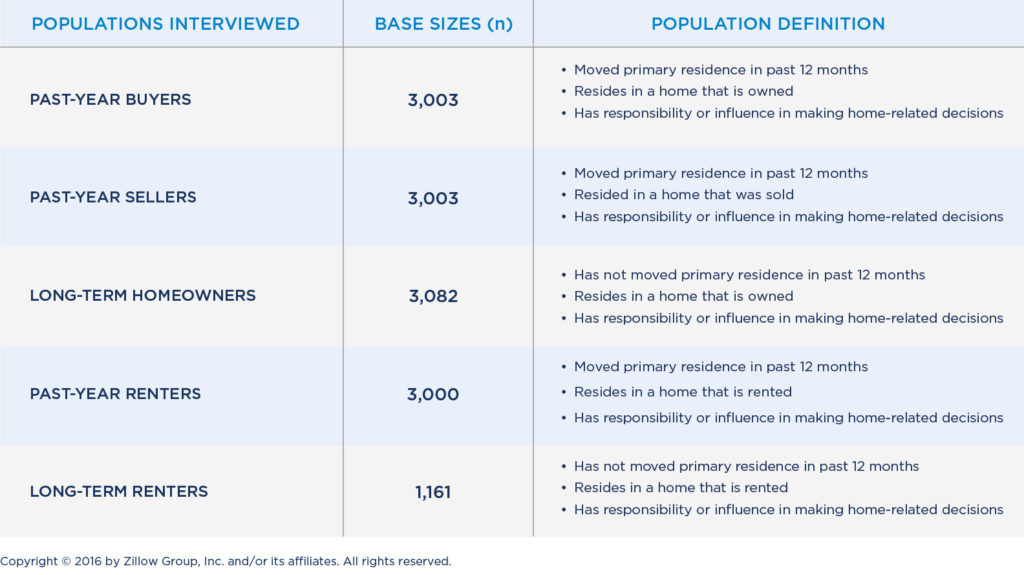
In addition to the subgroup-specific definitions stated above, all respondents surveyed were ages 18-75.
Research Design & Analysis | The survey gathered information on a wide range of areas, including but not limited to: home and community characteristics, behaviors and attitudes of buyers, sellers, and renters, resource usage, home financing, home maintenance and improvements, and the role of professionals (e.g., agents, property managers, landlords, mortgage providers, etc.). In addition to traditional analysis of stated metrics, MaxDiff analyses were also completed among the Past-Year Buyer and Past-Year Renter populations to understand preferences and trade-offs when deciding on a home to buy or rent, respectively.
Sampling & Weighting | Data was gathered via both General Market and additional targeted subgroup sampling to guarantee robust base sizes for analysis. Additionally, several steps were taken to ensure sample representativeness. The initial sending of General Market sample was balanced according to the U.S. 2010 Census population. The associated screening data on age, gender, income, ethnicity and region was weighted to correct for response rates. Additionally, all data were reviewed to ensure that the subgroup populations were representative and in accordance with age and ethnicity of their respective housing subgroup.
Quality Control | Several quality control measures were taken to ensure data is accurate: proprietary digital fingerprinting techniques were employed to identify and terminate any professional respondents, robots, or those taking the survey on multiple devices; speeder checks ensured those who rushed through the screener or survey did not count as complete; in-survey quality control checks identified illogical or unrealistic responses. Anyone identified via digital fingerprinting, speeders, and those who failed a given number of quality control checks within the survey were not counted as completes. Additionally, the study was blinded—Zillow Group was not revealed as the sponsor—to reduce response bias.
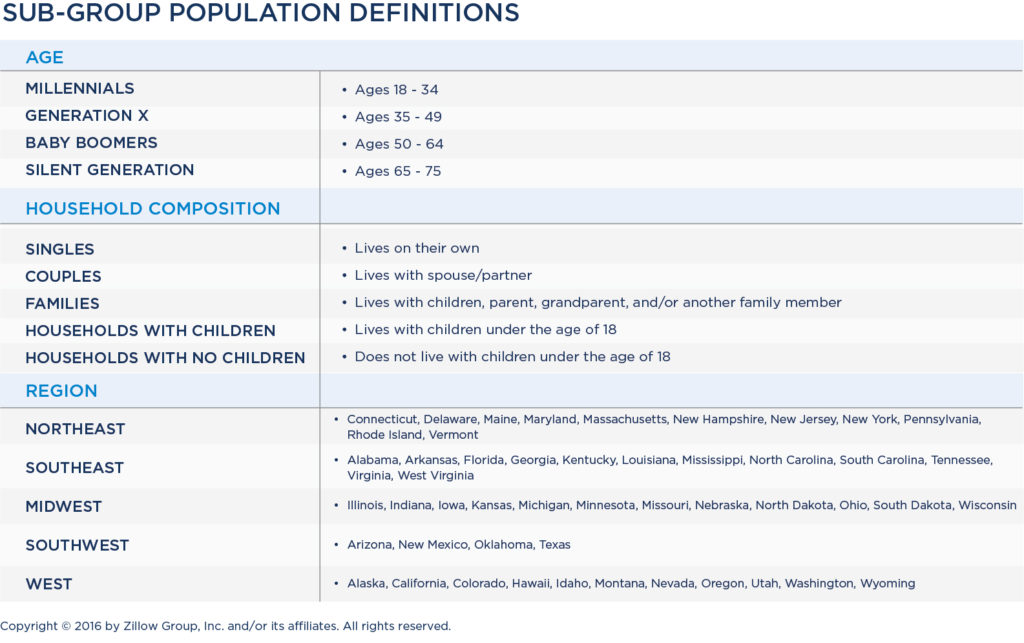
Reporting by Sub-groups | In addition to the consumer housing populations, the report also breaks down results by the following sub-groups:
Executive Summary
The home buying experience is both an intimidating financial transaction and an emotional milestone. Half of home buyers in the U.S. are under 36, meaning a new generation—Millennials—is shaping the future of real estate. Despite demographic reports about young adults’ urban lifestyles, Millennials share their parents’ aspirations for a single-family home, often in the suburbs.
The process of finding or selling a home is much more collaborative for Millennials than for older generations. They bring all available tools to the process, including their smartphones, social media and online networks. While older generations rely on real estate agents for information and expertise, Millennials expect real estate agents to become trusted advisers and strategic partners.
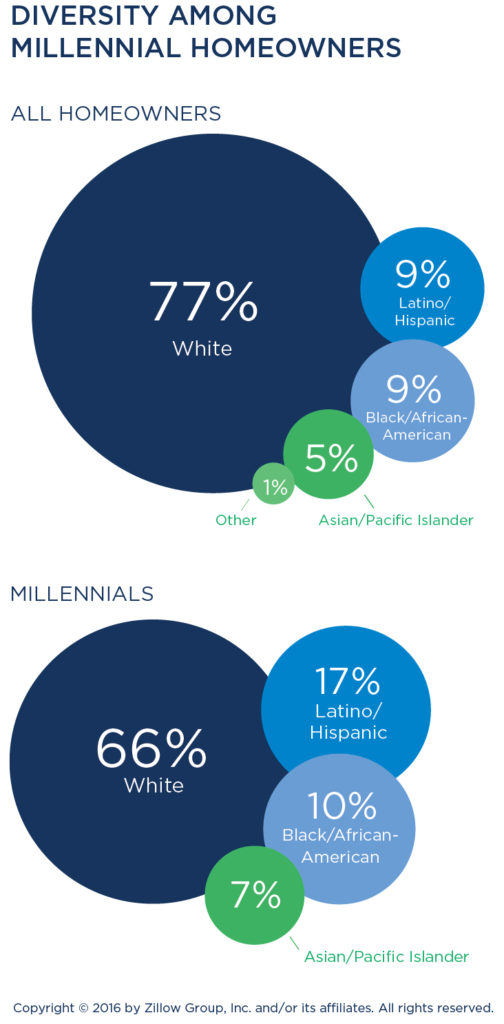
Millennial home buyers are also diverse. While only 9 percent of all homeowners are Hispanic, nearly 15 percent of the Millennials buying homes are Hispanic—reflecting the changing demographics of the American middle class.
Homeownership remains a vehicle for wealth in the U.S., but it can also be a financial burden, as families stretch their finances to afford the space they need, and large, dated homes owned by Baby Boomers and the Silent Generation demand maintenance and improvements.
Buyers
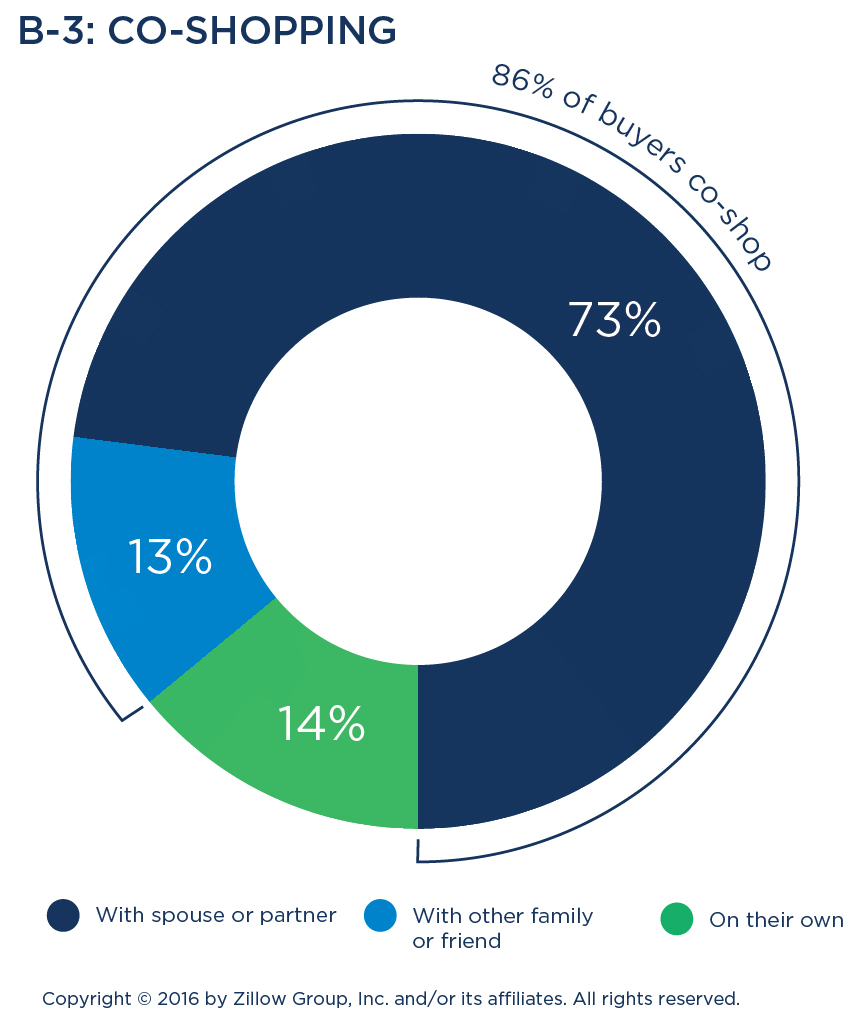
- Half (50 percent) of today’s home buyers are under the age of 36, and 47 percent are first-time buyers. Solo home buyers are in the minority; most buyers are shopping with a spouse or partner (73 percent).
- Eighty-three percent of buyers are shopping for a single-family house. Their top considerations are affordability and being in a safe neighborhood.
- Fifty-two percent of buyers consider renting while they’re shopping for a home—a number that’s even higher among younger buyers.
- Seventy-five percent of buyers hire a real estate agent during the buying process.
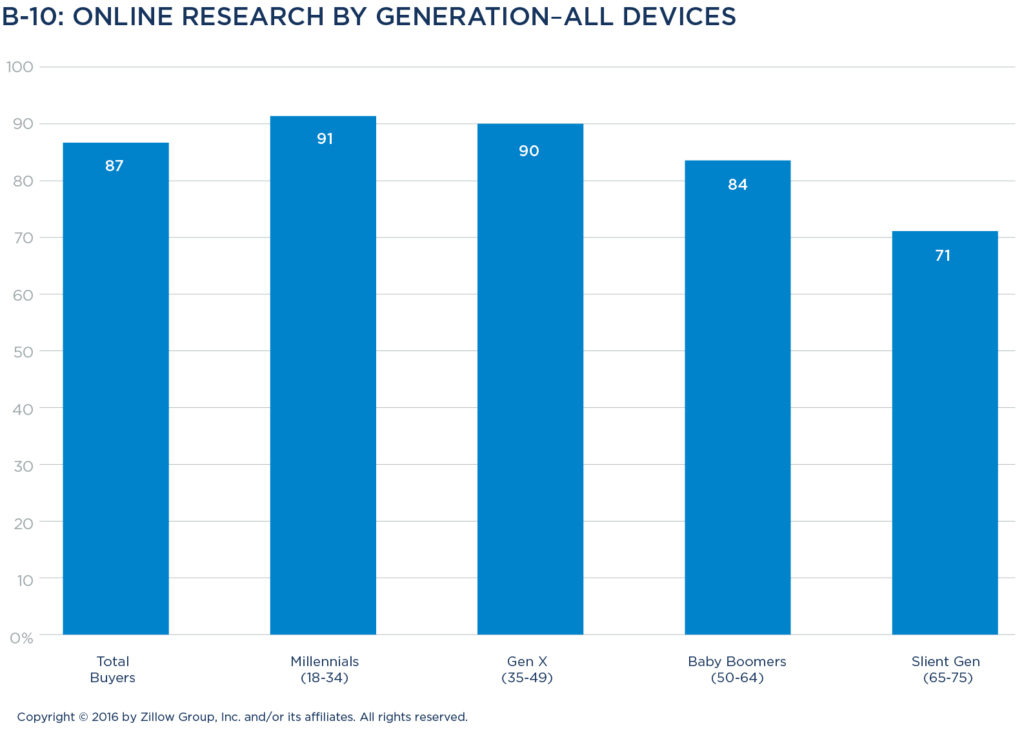
- Across all generations, almost nine out of 10 buyers (87 percent) use an online resource at some point in their search for a home to buy.
- Millennial home buyers share many concerns and preferences with their grandparents’ generation, both choosing homes with shared community amenities and considering townhouses at higher rates than those ages 35-49. However, Millennials’ home-buying process is significantly different from their grandparents’ process.
- Millennial home buyers wait longer to buy a first home than previous generations.i The modern-day “starter home” is nearly as large as the median home for “move-up” buyers, and costs about 18 percent less.
- Millennial home buyers undertake far more social home searches, seeking input from friends, relatives and neighbors 58 percent of the time, versus the Silent Generation, who poll friends just 37 percent of the time.
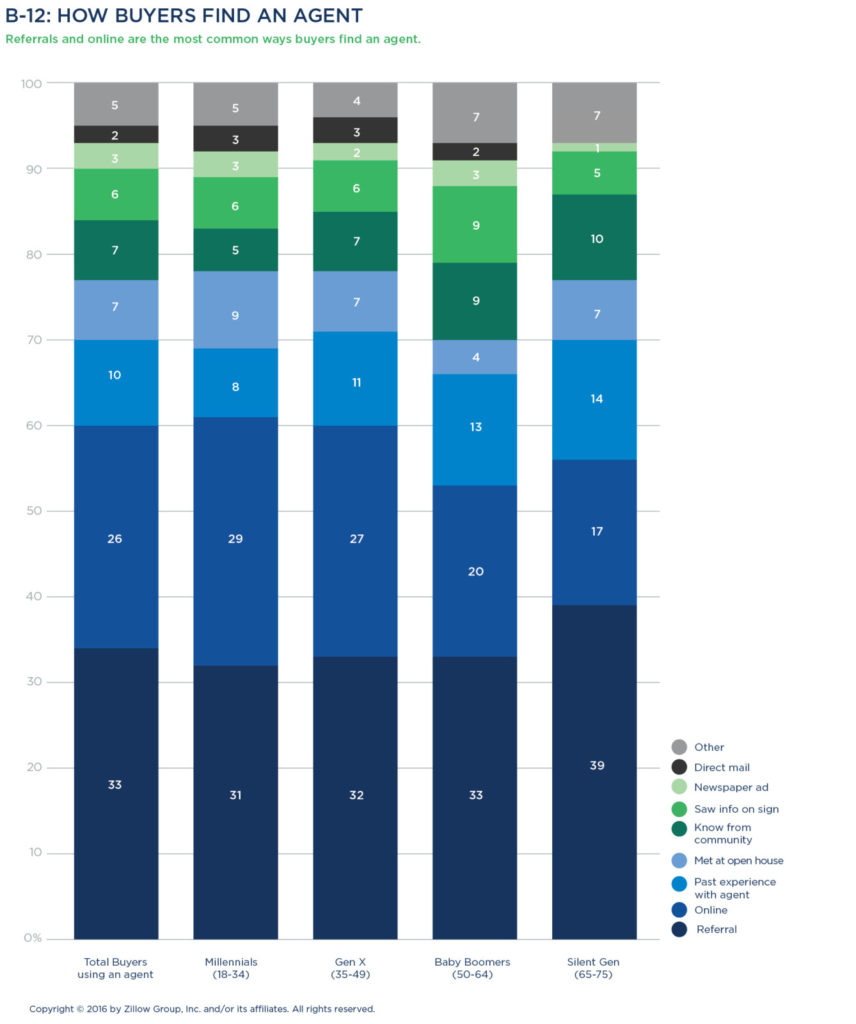
- More than a quarter (26 percent) of buyers find an agent online. A third (33 percent) find an agent through a personal referral.
- Millennials scrutinize more agents, asking friends and family about their experiences with agents and reading online reviews more than other generations.
- When it comes to choosing an agent, Millennials and other generations share their top priority: a sense that an agent is trustworthy and responsive to their needs.
- The average shopper goes on seven home tours, and while they may incorporate online research, they tend to be hands-on at decision time, preferring to meet an agent in person or talk on the phone, and prioritizing private tours of homes led by a professional.
- Only 46 percent of buyers get the first home on which they make an offer, reflecting the reality that in today’s tight market, the search—which takes an average of 4.2 months—comes with competition and disappointment.
- Over half of buyers (56 percent) save up for a down payment by setting aside a little money at a time. Almost a third (32 percent) use more than one source for their down payment, including gifts and loans from family, selling stocks and bonds, and cashing in retirement savings.
Sellers
- Today’s sellers are most often members of Generation X (38 percent), and the majority (63 percent of all sellers) are listing a home for the first time.
- Those listing a home for sale commonly had a recent job change or promotion (26 percent), a shift in financial circumstances (24 percent), retirement (16 percent) or another life change, such as the birth of a child, marriage, divorce, or becoming an empty nester.
- Most sellers are trading their homes for one they see as an upgrade, seeking a median of 100 more square feet and a home that costs an average of 11 percent more.
- Sellers’ top regret was that they didn’t take more time to prepare for a sale (30 percent). Women consider selling for an average of 5.9 months before listing; men consider it for 4.6 months.
- Eighty-eight percent of sellers use an agent to sell their home, and the majority (69 percent) of sellers who use an agent elect to bring them on board at the beginning of the process.
- Unlike buyers, Millennial sellers are just as likely as older generations to use an agent for a sale. However, Millennials are more likely than older generations to use online resources in their sale as well.
- Sellers look to their agents most often for pricing help (50 percent) and contract negotiation (35 percent). Millennials tend to rely on their agent for legal advice and determining the best time to list their home for sale.
- Eighty-three percent of sellers make home renovations before listing. The most common improvements are painting (45 percent) and renovating the bathrooms (31 percent).
- When marketing their homes, Millennials are more likely than older sellers to use video footage (29 percent) and promote their listing on social media (28 percent).
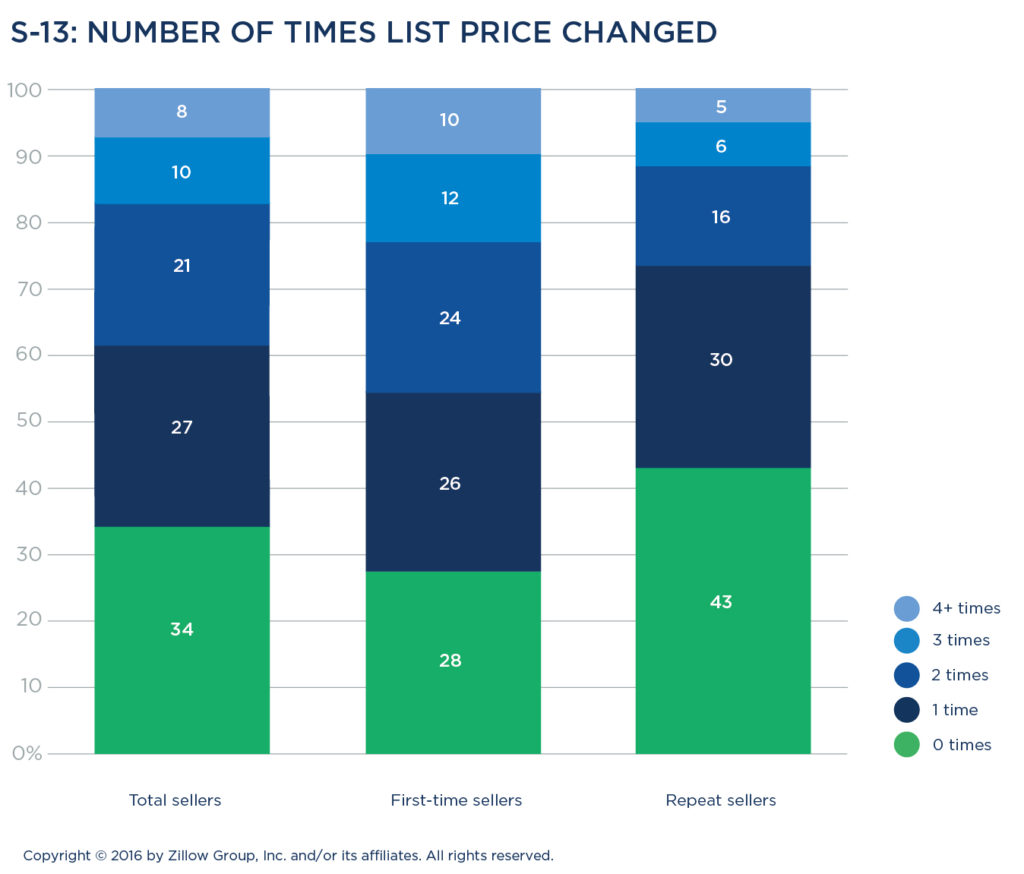
- In the time it takes to sell—2.8 months on average—two-thirds of sellers (66 percent) elect to change their listing price at least once. Thirty-nine percent changed the listing price of their home two or more times.
Homeowners
- The average U.S. homeowner—meaning those who have lived in their home at least one year—is white (77 percent), a Baby Boomer (35 percent) and college-educated (64 percent). Forty-eight percent earn $75,000 or more a year.
- Three-quarters (73 percent) of homeowners live with a spouse or partner. Thirty-five percent have children under 18 living with them, and 44 percent live with a pet.
- More than half (52 percent) of U.S. homeowners live in the suburbs, 23 percent live in urban areas and 25 percent in rural areas. A larger share of Millennial homeowners live in urban areas than older generations, but 47 percent live in the suburbs.
- More than half of all homeowners purchased a property that needed updates.
- Of homeowners making repairs and updates to their homes, 62 percent say they’d prefer to do the work themselves over hiring a professional.
- Forty-three percent of mortgaged homeowners have refinanced their mortgage at least once.
- Ninety-three percent of homeowners say they have no interest in renting out part of their primary home to strangers in order to make extra money, although owners in the West are slightly more open to the idea.
Renters
- Renters are disproportionately female (57 percent) and people of color (48 percent), and 58 percent earn less than $50,000 a year. They are also younger than homeowners—84 percent are under 50.
- While looking for a rental, 58 percent of renters consider buying a home instead.
- Forty-eight percent of renters consider a single-family house, but only 28 percent lease one.
- Renters spend an average of 10.4 weeks searching for a home, and they typically contact five landlords or property managers and submit three applications.
- Renters’ top priorities are finding a home in their budget, living in a safe neighborhood, and finding a place that accepts pets.
- The median monthly rent in the U.S. is $872 a month, but it varies by region.
- $1,100 in the West
- $1,000 in the Northeast
- $875 in the Southwest
- $800 in the Southeast
- $715 in the Midwest
- Thirty-five percent of renters who have not moved within the last year have no plans to move.
Today’s Home Buyer
Today’s home buyers are redefining so-called starter homes and buying the most expensive home they can afford—and freestanding houses are their top choice. Dominated by older Millennials and younger members of Generation X, today’s buyers instinctively use virtual tools and word of mouth to understand what’s happening in their market, but mirror older generations in their appreciation for the local expertise and guidance agents contribute to the buying process.
Most buyers finance their home purchase with a mortgage and most are shopping for a new home in the area where they already live. In today’s competitive housing market, nearly all buyers get pre-approved for a loan early in the home shopping process, and they typically make more than one offer before succeeding with a purchase. To find an affordable home in the right location, buyers will consider fixer-uppers, foreclosures and even properties just outside their budget.
BUYER CHARACTERISTICS & CONSIDERATIONS
Buyers are young, educated and diverse
Buyers are defined as people who moved into a home that was purchased within the last year, which includes the main decision-makers and household members who had a say in the decision.
The typical home buyer is in their mid-to-late 30s or early 40s, married (67 percent), college-educated (75 percent), and on the hunt for a single-family home (83 percent). They have a median annual household income of $87,500. Seventy-five percent are Caucasian, with additional representation among Latinos/Hispanics (11 percent), black/African-Americans (7 percent) and Asians/Pacific Islanders (5 percent).
While the majority of buyers in America are married, single buyers (23 percent) and households of unmarried partners (10 percent) comprise more than one-quarter of the marketplace.

Millennials, ages 18-34, comprise 42 percent of all home buyers today, while an additional 31 percent of buyers are members of Generation X (ages 35-49). Baby Boomers (ages 50-64) and the Silent Generation (ages 65-75) together make up the smallest share of home buyers (26 percent), with only 10 percent of buyers over age 64.
 Nearly half buying for the first time
First-time buyers, a group that makes up almost half (47 percent) of the buying market, have a median age of 33 and nearly six in 10 are Millennials (56 percent). They spend a median of $200,000 on a home. They are more likely than repeat buyers to be torn between buying and renting, with almost four in 10 seriously considering renting (37 percent, compared to just 12 percent of repeat buyers).
Repeat buyers are older, with a median age of 42. They have a preference for single-family homes over other home types, and pay an average of 18 percent more than first-timers for their home ($235,000 median price). Repeat buyers are slightly less decisive about location, with almost one in five (18 percent) purchasing a home in an area that is outside their initial search criteria, compared to just 14 percent of first-time buyers.
 Home shopping a shared project
Home shopping is a shared activity, with 86 percent co-shopping with a spouse or partner (73 percent) or a friend or other family members (13 percent). Half (50 percent) of buying households include children under the age of 18, with one quarter (25 percent) of all buyers indicating their children had some influence on their home purchase.
Seventeen percent of younger Millennials (ages 18-24) are shopping for a home with a friend or roommate, with an additional 51 percent shopping with a spouse or partner. Older Millennials (ages 25-34), are more like the average buyer, as 73 percent are shopping with a spouse or partner.
Typical home search takes about four months
Buyers spend 4.2 months on average shopping for a home. The Silent Generation has the fastest search timeframe—spending an average of 3.8 months, followed by Millennials, who typically shop for four months. Baby Boomers spend 18 percent more time than Millennials on their home search, averaging 4.9 months searching for a home to buy.
Along gender lines, men tend to shop faster than women. Forty-seven percent of men but only 39 percent of women report finding a home in less than three months. Women need a little more time: 45 percent found a home within three to six months, versus 38 percent of men.
Most buyers desire a single-family house

A freestanding, single-family house is buyers’ top choice, with 83 percent of all buyers seeking this home type. Buyers also consider townhouses (20 percent), condominiums or co-op dwellings (13 percent), duplex or triplex buildings (9 percent), or mobile or manufactured homes (8 percent). Fifteen percent of buyers sought raw land or an empty lot.

Buyers in the Southwest are the most likely to seek a single-family home, with 89 percent in the market for one. Compared to buyers in other regions, buyers in the Northeast are more likely to consider homes with shared walls, including townhouses (23 percent), condos/co-ops (15 percent) and duplexes/triplexes (14 percent). Buyers in the Midwest (10 percent) and Southeast (9 percent) are slightly more likely than other Americans to consider manufactured homes.
Housing by generation:
- Millennials are housing-flexible. They’re the most likely to look at townhouses (23 percent) or duplex/triplex properties (13 percent).
- Generation X buyers are the least interested in condos and co-ops. They mostly consider single-family homes (85 percent) followed by townhouses (17 percent).
- Baby Boomers show the highest willingness to buy manufactured housing (10 percent) and some interest in condominium or co-op homes (14 percent).
- Silent Generation buyers are less interested in single-family homes and among the most receptive to yard-free living in a condo/co-op (23 percent) or townhouse (21 percent).
Distressed properties an option for the budget-conscious
Distressed properties, including foreclosure, auction and short sale homes, remain fairly common in today’s real estate market, and roughly two in five buyers are open to purchasing these types of homes. Thirty percent of buyers consider purchasing a foreclosure, with women more likely to consider than men (32 percent versus 29 percent). In contrast, men are more likely to consider purchasing an auction home 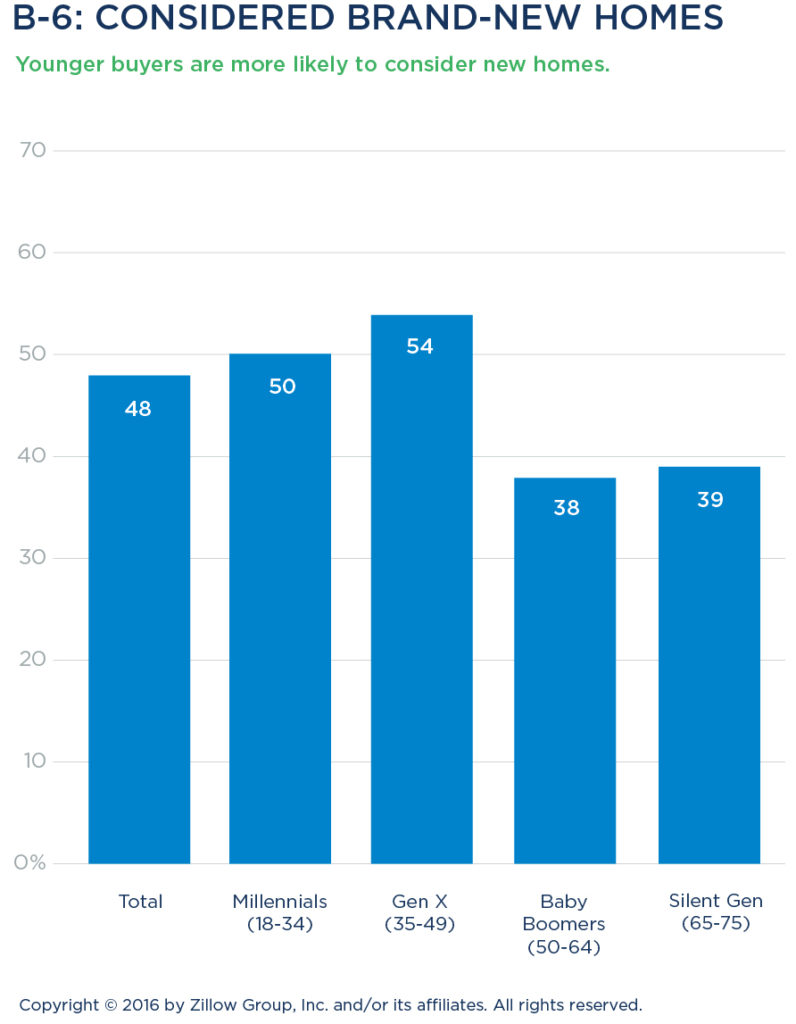 (18 percent versus 14 percent). Additionally, 28 percent of buyers consider purchasing a short sale—a home listed by a seller who owes more on their mortgage than the home can fetch.
Brand-new homes a popular consideration
Nearly half (48 percent) of all buyers consider homes that have never been lived in before. Younger buyers (50 percent of Millennials and 54 percent of Generation X) are significantly more likely than Baby Boomers or the Silent Generation (38 percent and 39 percent, respectively) to consider newly built properties. Additional cohorts showing a greater desire for brand-new homes include men (51 percent versus 44 percent of women), families with kids (55 percent versus 42 percent of households without kids), and those earning more than $75,000 (56 percent versus 40 percent of those earning less than $75,000).
Among buyers who were interested in and ultimately purchased brand-new homes, the following information is most desired during their search:
- Energy-efficiency savings (48 percent)
- Builder reviews/ratings (47 percent)
- Options for customizing the home (45 percent)
- Inventory of a community, including when a lot becomes available (44 percent)
Additional information desired by buyers of brand-new homes includes options for interior designs and finishes (41 percent) and community amenities such as playgrounds, fitness rooms and pools (37 percent).
Many buyers consider renting
While searching for a home, more than half of all home buyers (52 percent) also considered renting, with almost one quarter (23 percent) looking at the option seriously. Thirty-seven percent of first-time buyers seriously consider continuing to rent, and 12 percent of repeat buyers are seriously contemplating renting their next home instead of buying it.
Among generations, younger Millennial buyers (71 percent) are the most likely to consider renting. As buyers age, their interest in renting declines. Just over half (54 percent) of all Generation X buyers considered renting, around one-third (32 percent) of Baby Boomers did, and only 18 percent of those 65 years and older looked at it.
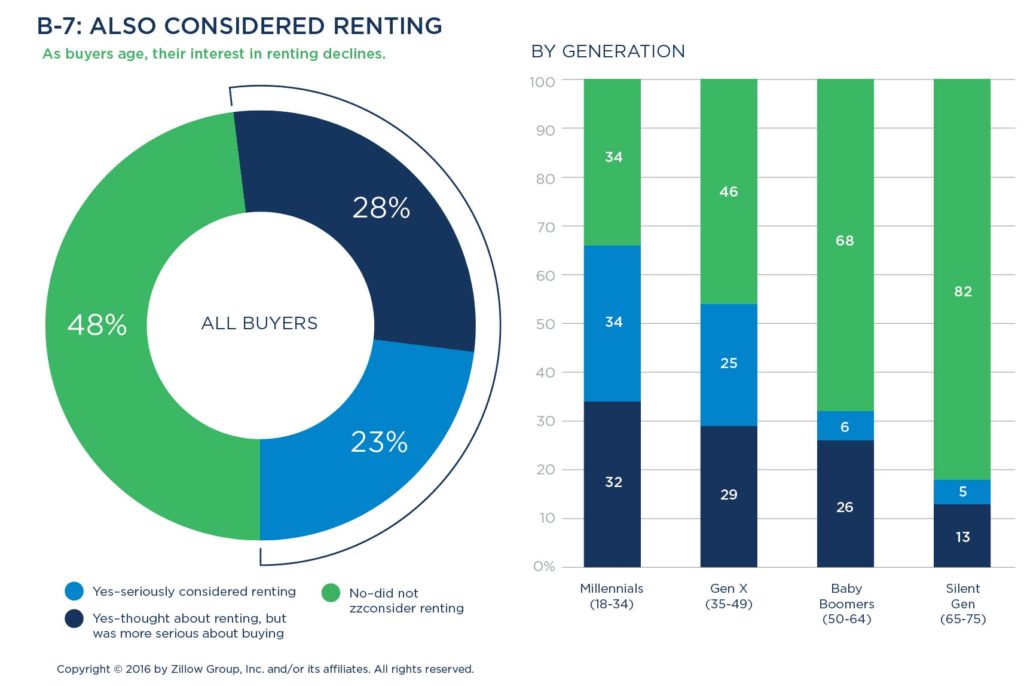
Men (55 percent) expressed more willingness to rent than women (45 percent), and also indicated more often than women that they seriously looked at renting (28 percent for men, 15 percent for women). Renting was also a common consideration among buyers in lower-income brackets.
SEARCHING & SHOPPING RESOURCES
Online resources and agents top the list
The majority of buyers rely on both online resources and guidance from a real estate agent during their home search. Eighty-seven percent of buyers use online resources and 75 percent select a real estate agent or broker to work with, suggesting that most buyers combine self-directed research using websites and apps with the market expertise and human touch offered by a real estate professional. In fact, buyers who utilize online resources during their home search are significantly more likely to also use an agent (77 percent versus 59 percent who do not use online resources).
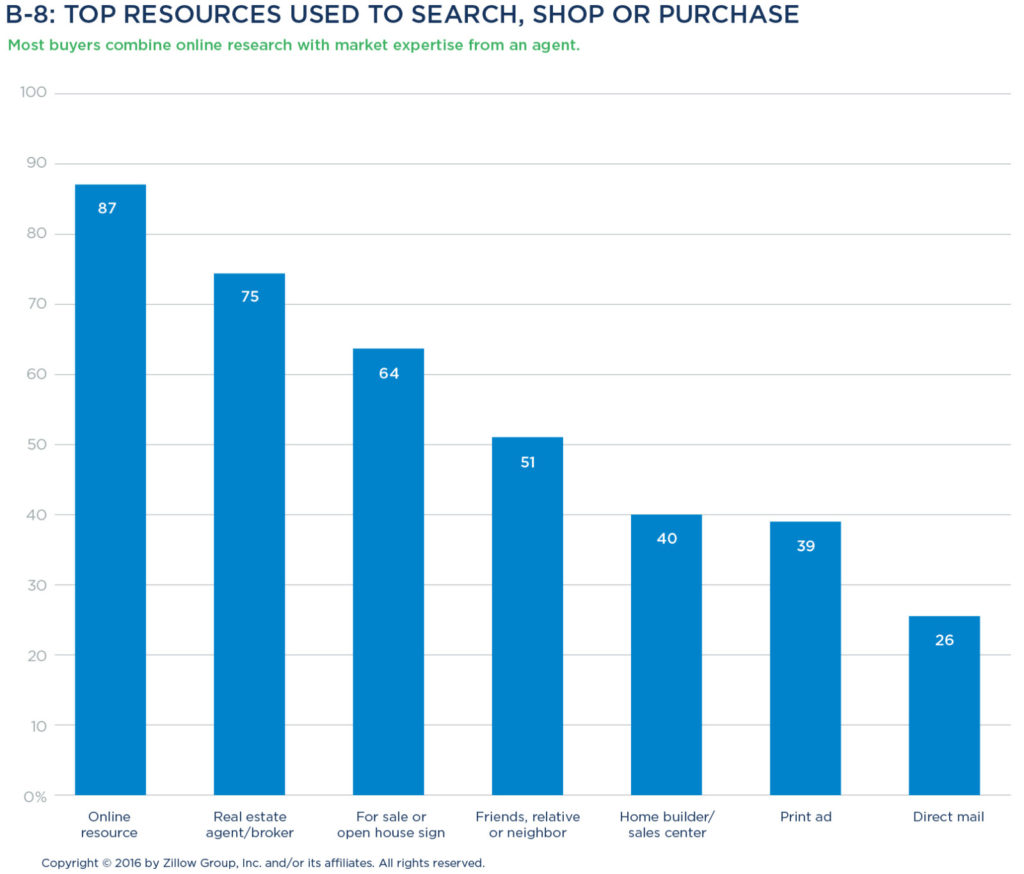
Additional resources utilized by buyers during their home search include for sale and open house signs (64 percent of buyers) as well as referrals from friends and family (51 percent). Buyers, particularly those
considering homes that haven’t been lived in before, often rely on sales centers and new home development offices as a resource (40 percent). Print ads (39 percent) and direct mail (26) are the least used resources.
Buyers use multiple devices to access online resources
Buyers using online resources during their home search are accessing them from a variety of devices, most often desktop computers (77 percent), followed by mobile websites (56 percent) and mobile apps (48 percent). Utilizing mobile devices to search for homes is most prevalent among buyers under age 50, with 66 percent of Millennial buyers and 62 percent of Generation X buyers accessing via mobile, compared to 42 percent of Baby Boomers and just 20 percent of the Silent Generation.
In addition to searching online and using agents, Millennials rely on their personal networks. They’re the generation most likely to turn to a friend, neighbor, or relative to inform their home search (58 percent, versus 52 percent of Generation X buyers, 42 percent of Baby Boomers, and 37 percent of the Silent Generation). They’re also more likely than older generations to visit a builder’s sales center and slightly more likely to consider direct mail a resource.
Use of agents varies by generation & ethnic group
The older the buyer, the more likely that buyer is using an agent. Baby Boomers and the Silent Generation rely most heavily on an agent or broker for real estate guidance, with 83 percent and 81 percent respectively citing them as a resource in their home search. Seventy-four percent of Generation X buyers report using an agent, followed by 70 percent of Millennials.
Although use of agents is relatively high among all racial and ethnic backgrounds, Asian/Pacific Islanders are most likely to use an agent (82 percent) compared to Caucasians and Latinos/Hispanics (76 percent and 71 percent, respectively). Black/African-American buyers are the least likely to use an agent (68 percent).
Other demographic groups more likely to use an agent include women (78 percent versus 73 percent of men) and those earning more than $75,000 (77 percent versus 61 percent among those earning less than $25,000). Additionally, repeat buyers are more likely to use an agent than first-timers, with 78 percent of repeat buyers hiring one versus 70 percent of first-timers.
Half of buyers enlist an agent at the start
Just over half (51 percent) of buyers who use an agent involve them at the very beginning of their home search. Forty-one percent get started on their own, choosing to enlist an agent before they make an offer. This includes 27 percent who involve an agent after they have been searching for a while but before they tour any homes, and 14 percent who enlist an agent after they have started touring, but before starting the offer process. Baby Boomers are more likely than other generations to begin touring homes independently before selecting an agent, with 19 percent of this generation doing so.
Just 7 percent of total buyers who use an agent wait until they’re ready to make an offer before enlisting their services.
Buyers consider at least two agents
The average number of agents buyers consider hiring is 2.2. Slightly more than half (53 percent) of buyers using an agent considered multiple agents, with 26 percent choosing from two. There are marked differences among the number of agents considered when it comes to the generational cohorts. Sixty-eight percent of the Silent Generation and 57 percent of Baby Boomers considered only one agent, compared to 44 percent of Generation X and 38 percent of Millennials considering just one agent.

While 33 percent of buyers find an agent via referrals, nearly that many—26 percent—are finding an agent online. Only 3 percent of buyers find their agent through newspaper ads, and 2 percent find them through direct mail such as postcards or newsletters.
Millennial and Generation X buyers are more likely to find their agent online, with 29 percent and 27 percent respectively finding an agent through this resource. Just 20 percent of Baby Boomer and 17 percent of Silent Generation buyers use the internet to find their agent.
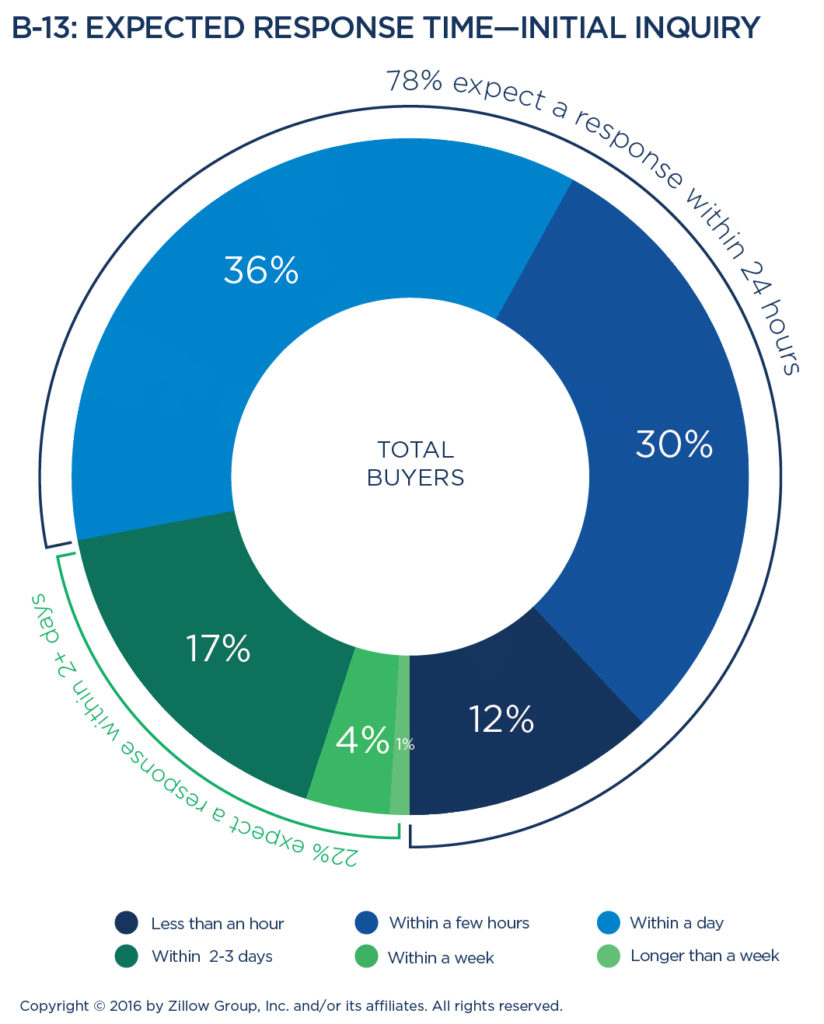 Buyers expect fast response to initial inquiry
 The older the buyer, the faster they expect an agent to respond to their initial inquiry. Over half of Silent Generation buyers (52 percent) expect agents to get back to them within a few hours, versus 47 percent of Baby Boomers, 40 percent of Generation X buyers and 40 percent of Millennials.
Among all buyers, 78 percent expect a response within one day. Only 22 percent consider it acceptable for an agent to take two or more days to respond.
Local market knowledge and a positive first impression are key
Buyers scrutinize prospective agents in multiple ways, including:
- Evaluating an agent’s local market knowledge (60 percent)
- Reviewing brokerage websites (58 percent)
- Asking friends and family about experiences with an agent (56 percent)
- Reading online agent reviews (50 percent)
- Reviewing agents’ sales histories (46 percent)
- Interviewing agents (44 percent)
Millennials are particularly likely to evaluate an agent online, including reading online reviews (61 percent) and delving into past sales data (57 percent).

First-time buyers in particular devote considerable effort evaluating potential agents. These buyers are much more likely to read online reviews (62 percent versus repeat buyers at 41 percent), check an agent’s sales history (56 percent versus repeat buyers at 39 percent), and ask friends and family about an agent (61 percent versus repeat buyers at 53 percent).
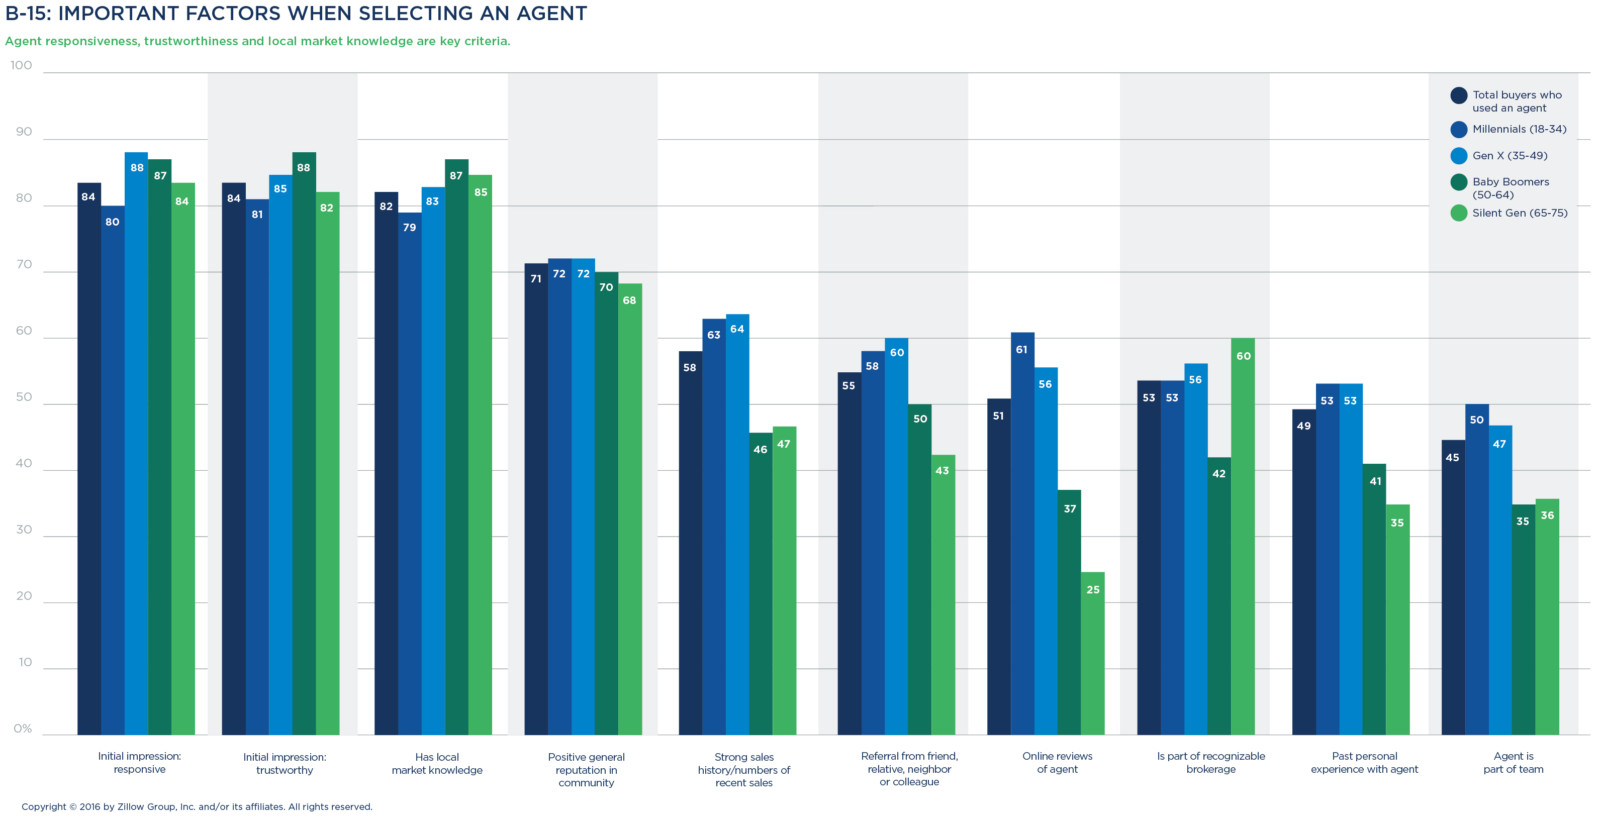
Ultimately, buyers’ first impressions and confidence in an agent’s local market knowledge are the most important factors in their decision to hire a particular agent. More than 80 percent of buyers chose these traits as top determining factors in choosing an agent, viewing them as more important than an agent’s recent sales results, a personal referral, or being a part of a recognizable brokerage.
Regionally, being part of a recognizable brokerage is of particular importance to buyers in the Northeast (59 percent versus a 52 percent average for other U.S. regions). Buyers in the West place more importance on having a referral from a friend or relative (61 percent versus a 54 percent average for other U.S. regions) and checking online agent reviews (56 percent versus a 50 percent average for other U.S. regions).
Regarding first impressions, buyers prioritized both trustworthiness and responsiveness as traits they’re looking for when first meeting an agent. Women in particular value these two traits as top criteria when selecting an agent (88 percent for each, versus 81 percent and 83 percent, respectively, for men).
Preferred communication is via phone call
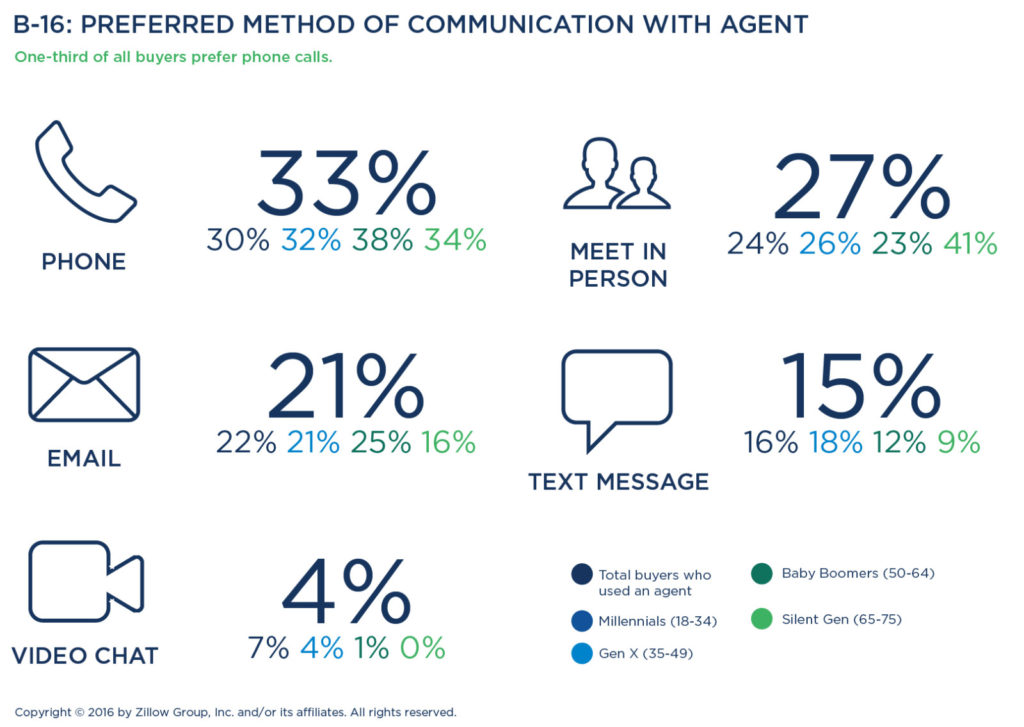
When it comes to regular communication with an agent, one-third of all buyers prefer phone calls, while in-person meetings appeal to just over a quarter of buyers (27 percent) and are of particular interest to the Silent Generation (41 percent versus an average of 25 percent for younger generations). Baby Boomer buyers (25 percent) show the highest preference for email interaction, while Millennial and Generation X buyers are slightly more amenable to texting (Millennials 16 percent, Generation X 18 percent).
Home tours rank as top service
The top service buyers want from their agents is private home tours (67 percent). They’re also depending on agents for notifications about new homes on the market (58 percent) and pre-screening homes (44 percent). Additionally, buyers ask agents for referrals to home inspectors (34 percent) and mortgage lenders (25 percent), and even to provide listings that fall outside their expressed buying criteria (31 percent).

First-time buyers prefer seeing homes in person (62 percent) to having them previewed by an agent (40 percent), and are more interested in inspector referrals and seeing listings outside their initial search criteria. Repeat buyers are more receptive to agents previewing homes for them (47 percent) but still appreciate in-person tours (72 percent).
Silent Generation buyers (78 percent) expect agents to give them private home tours, compared to 66 percent for younger generations. Across racial and ethnic lines, Asians/Pacific Islanders and whites/Caucasians also place high value on private home tours (71 percent and 69 percent, respectively, versus 60 percent for Latinos/Hispanics and 58 percent for blacks/African-Americans).
Women more often care about private home tours (72 percent of women, 65 percent of men) and getting information on new listings from their agent (63 percent of women, 56 percent of men), while men are more open to having an agent screen properties (48 percent of men, 37 percent of women).
 Snapshot: The Many Faces of Homeownership
Owning a home is fundamental to the American Dream and is a goal shared by Americans of all racial and ethnic backgrounds. While people of color are traditionally under-represented compared to the population as a whole, that is gradually changing as younger, more diverse buyers enter the market.
More than three out of four homeowners today (77 percent) are Caucasian, while less than 10 percent are black/African-American (9 percent) or Latino/Hispanic (9 percent). Just 5 percent of today’s owners are Asian or Pacific Islanders.
Caucasians make up 75 percent of recent buyers, which is a slightly smaller share than long-term homeowners. Eleven percent of recent buyers are Latino/Hispanic, but only 7 percent are black/African-American. Asians/Pacific Islanders account for 5 percent of recent buyers.
For comparison, 15 percent of the U.S. population is Hispanic, according to the U.S. Census Bureau, and 65.5 percent is white.ii
Young buyers introduce diversity
Millennial buyers are more likely to be Hispanic/Latino than their older counterparts. Generation X buyers include the largest percentage of non-white buyers, compared to other generations.
Non-whites and Millennials are more likely to associate homeownership with the American Dream, according to the Zillow Housing Confidence Index. Of Hispanic respondents to a 2016 survey, 70 percent agreed that owning their own home is necessary to live the American Dream, followed by 64 percent of Asian/Pacific Islander respondents and 63 percent of black respondents. By comparison, only 58 percent of white respondents agreed.
Fourteen percent of Millennial buyers are Latino/Hispanic, whereas roughly 11 percent of Gen X, 7 percent of Baby Boomers and 6 percent of Silent Generation buyers are Latino/Hispanic. Some 6 percent of Millennials are black/African-American, a smaller share than Gen X (9 percent) or Boomer (8 percent) buyers who are black/African-American.
First-time buyers and owners are diverse
Non-white buyers make up a slightly higher share of first-time buyers than repeat buyers. Homeowners who are not white are more likely to be in the first home they ever purchased: Twenty-nine percent of first-time owners are of a racial background other than Caucasian, whereas only 17 percent of repeat owners are non-white.
HOME SELECTION & PURCHASING FACTORS
In-person tours are paramount
When determining which homes to consider purchasing, home buyers place importance on a variety of methods, including:
- Taking a private tour of the home (78 percent)
- Having an inspection/pre-inspection (78 percent)
- Having access to comprehensive data and history about the home (67 percent)
- Viewing a floor plan of the home (64 percent)
- Getting their agent’s evaluation of the home (54 percent)
- Viewing professional pictures of the home (52 percent)
- Having the home empty/free of the previous seller’s belongings (51 percent)
- Attending an open house of the home (48 percent)
- Watching a video tour of the home (35 percent)
- Having the home be staged (33 percent)
Each of these methods is more important to Millennial and Generation X buyers compared to buyers over age 50. Private tours, having an inspection, and getting access to comprehensive data about the home are nearly equally desired among the age cohorts.
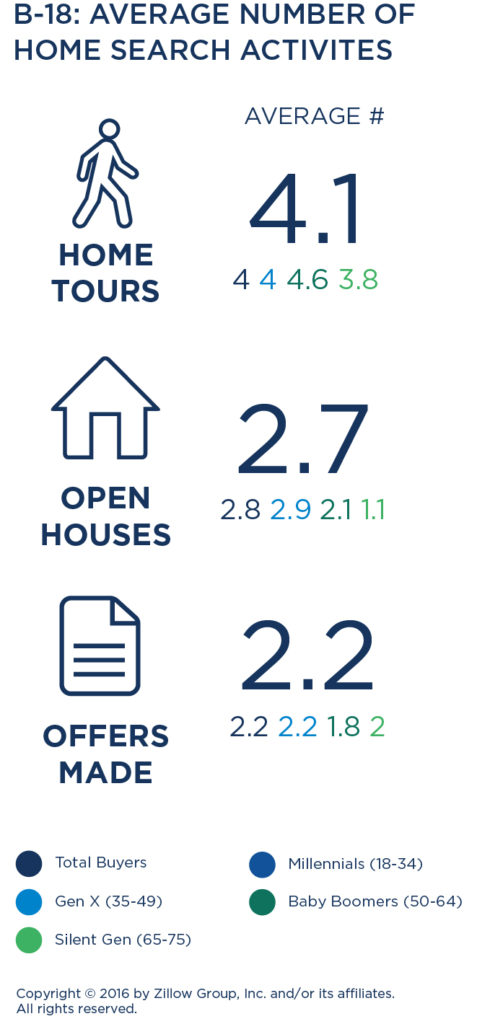
Once their search is underway, the average buyer visits about seven homes. They attend an average of three open houses and go on an average of four private home tours.
The majority (71 percent) of all buyers attend at least one open house, with first-time buyers (77 percent) more likely than repeat buyers (65 percent) to attend at least one open house. Buyers in the Northeast (77 percent) and West (76 percent) are the most likely to attend at least one open house.
Women and Southwesterners tend to take an average of one additional private tour, averaging five private tours each, versus four for men and residents of other U.S. regions.
For today’s buyers, it’s become the norm to make more than one offer before succeeding in closing on a purchase. Just under half (46 percent) of all buyers successfully close on their first home offer, with one-quarter (24 percent) making three or more offers. Those more likely to close on their first offer include women (55 percent versus 40 percent for men), the Silent Generation (56 percent versus an average of 45 percent for younger generations) and those without kids in the household (52 percent versus 40 percent for those with kids). Those who most often make five or more offers before closing on a purchase include buyers in the West (9 percent) and Northeast (8 percent), those purchasing duplexes or triplexes (12 percent) or brand-new homes (10 percent).
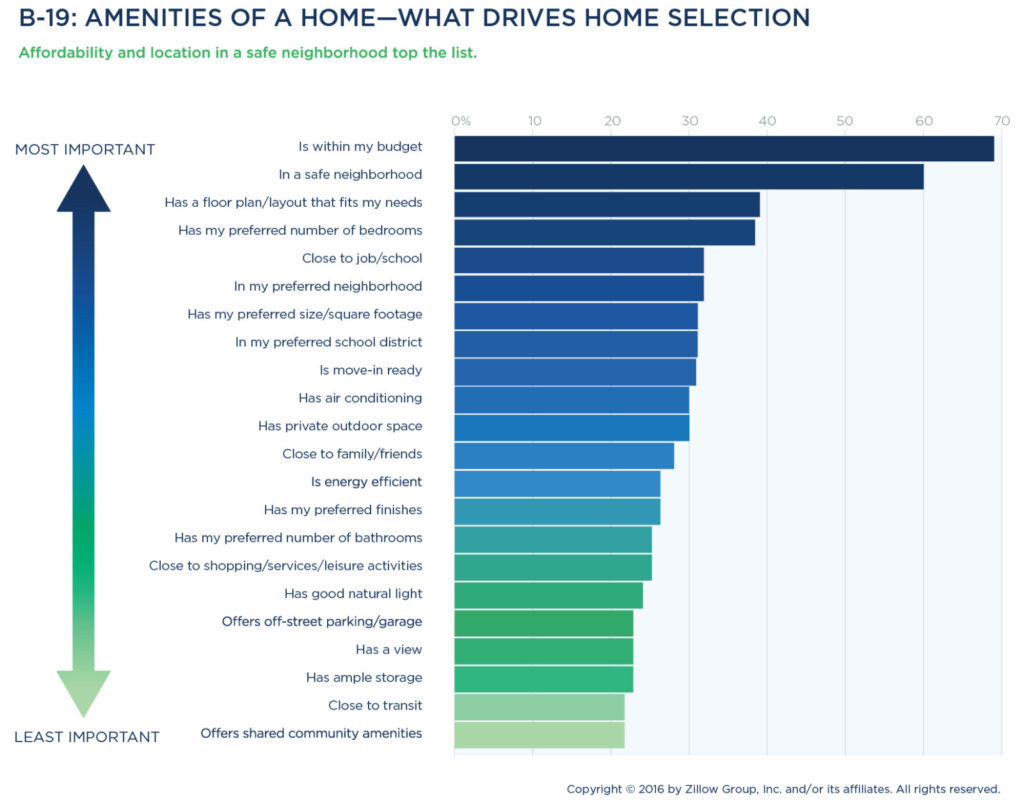
Affordability and safety are most important
By far, the top two traits most likely to drive selection of a specific home are its affordability and location in a safe neighborhood. When it comes to interior features of a home, buyers tend to prioritize usability and space: Having a floor plan or layout that meets their needs is just as important as having their preferred size/square footage.
Buyers also appreciate a home that is move-in ready and has air conditioning (especially in the South) over having their preferred finishes. Having a view or ample storage are the interior features that are least likely to have an impact on home selection.
Buyers also seek homes in locations that offer a good work commute and are within their preferred neighborhood. These location-based factors are all big drivers of home selection for both Millennials and Generation X, and are often more important than being close to friends and family, or shopping. Location-based features with the least impact on driving home selection include being close to transit or offering shared community amenities.
Single-family homes are predominant choice
Most home buyers are looking for a single-family detached house (83 percent), and indeed most buyers end up purchasing this type of home (78 percent). Millennials and the Silent Generation are slightly more likely than those ages 35-64 to consider townhouses (23 percent and 21 percent, respectively), with half of all who consider townhouses purchasing one.
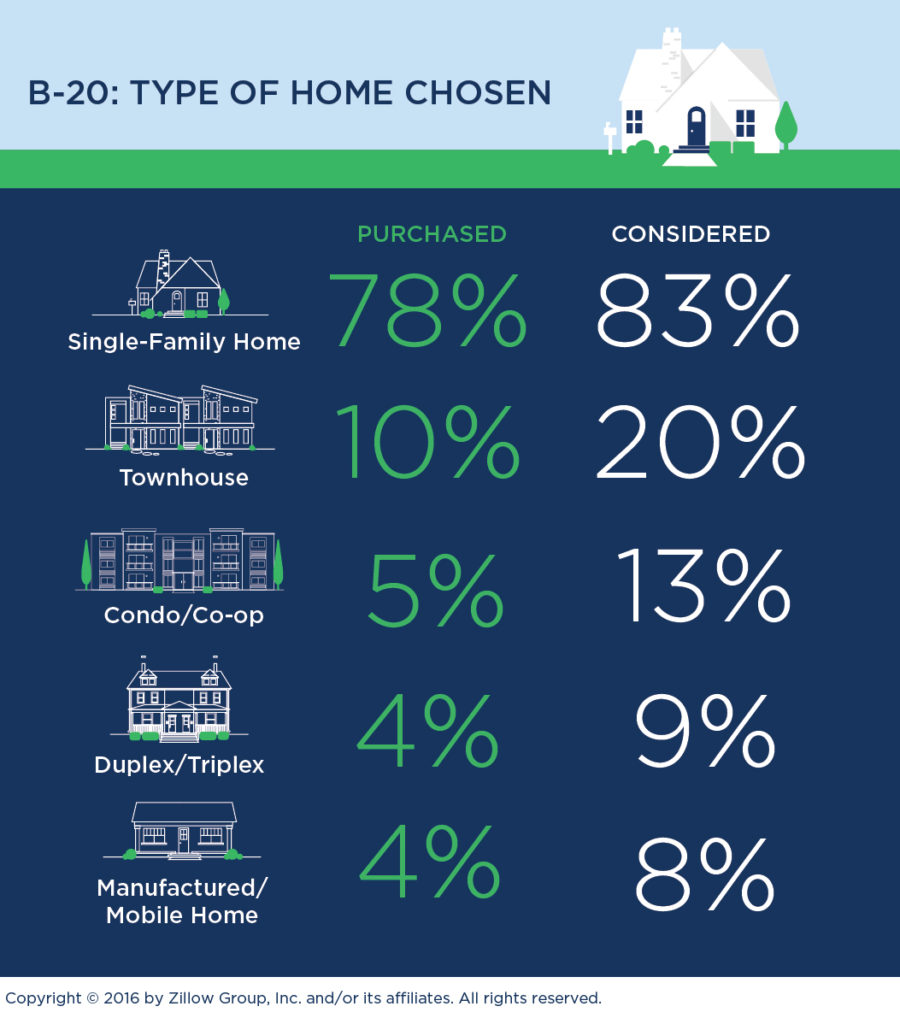
Condos appeal to young and old
Thirteen percent of buyers considered condos/co-ops, with 5 percent purchasing one. Condo buyers report that they chose this type of home because a condo is the best choice at this stage of their life (44 percent), it’s the right size for them (41 percent), and because the condo is in their desired location (40 percent).

 Typical home purchase
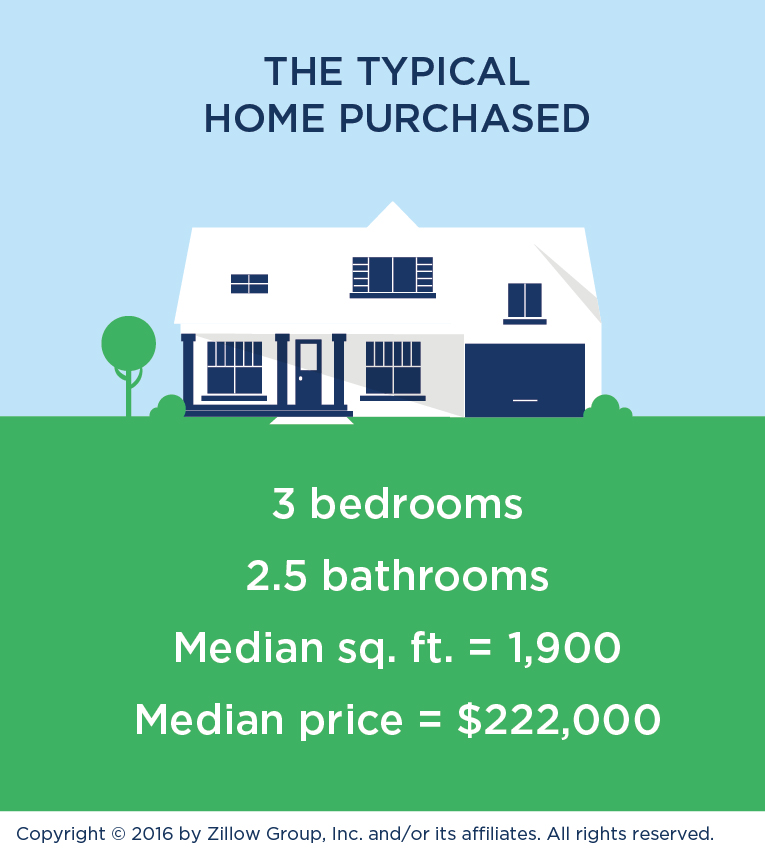
The median home purchased today has 1,900 square feet and features three bedrooms, 2.2 full bathrooms and one partial bathroom. The Silent Generation and Millennials are buying homes with slightly smaller footprints, with a median size of 1,700 square feet and 1,800 square feet, respectively. Generation X and Baby Boomer buyers are choosing slightly larger homes of 2,000 and 1,950 square feet, respectively.
The median price of a home is $222,000. First-time buyers are paying a median price of $200,000 on a new home—just 18 percent less than repeat buyers, who spend $235,000 on their home—indicating that first-time buyers are stretching their resources to afford a starter home they can stay in for awhile.
Generation X buyers spend a median of $245,000, which is the most of any generation. Boomers are spending the least amount of money on homes—a median of only $200,000.

One-third of buyers exceed their initial budget when buying a home (32 percent), and nearly half of all buyers of brand-new homes pay north of budget (48 percent). First-time buyers are more likely to exceed their budget (39 percent) than repeat buyers (26 percent). Those who are pre-approved (34 percent), Millennials (37 percent) and residents of Western states (39 percent) pay above budget slightly more often than their counterparts.

Almost six in 10 buyers (57 percent) say they made major repairs to a property they bought—with about half making the repairs themselves and half arranging for the seller to make repairs as a condition of the sale.
Younger buyers were more likely to request that the seller do repairs on the home they were buying. Six in 10 Millennial buyers asked the seller to make the major repairs, compared to 52 percent of Gen X buyers, 35 percent of Baby Boomers and 31 percent of the Silent Generation.
Value and location top reasons to seek a brand-new home
Just 10 percent of buyersiii end up selecting a home that hasn’t been lived in before. When asked why they sought out newly built properties, these buyers cited reasons including affordability (35 percent), being in a desirable location (31 percent), having appealing home features (29 percent), ability to customize features of the home (28 percent), and free upgrade options (24 percent). Millennials are significantly more likely than older buyers to purchase a brand-new home for its curb appeal (19 percent).
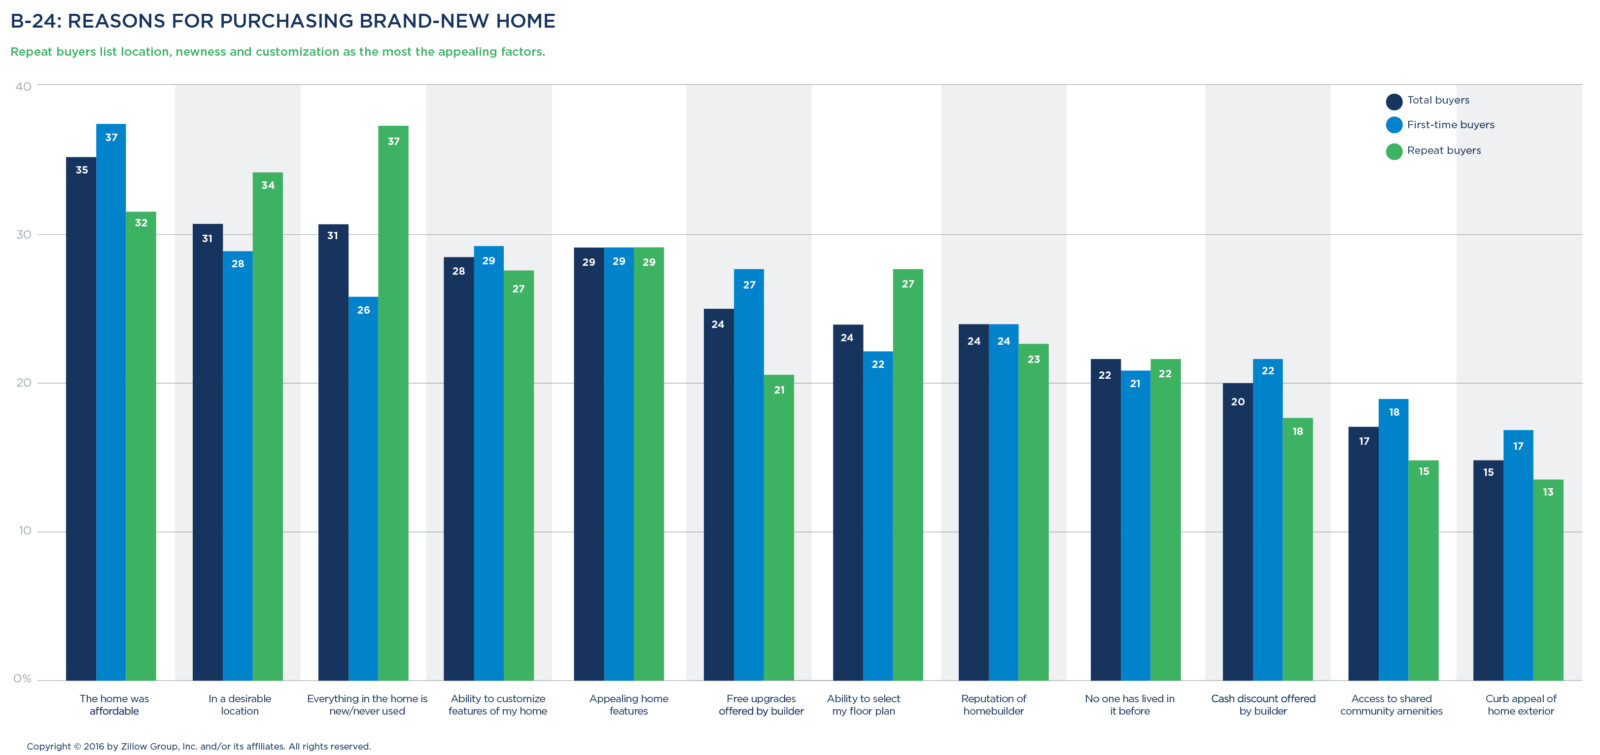
Additional appealing features of these brand-new homes include having a choice of floor plans (24 percent), receiving cash discounts from builders (20 percent), and access to community amenities such as a pool or playground (17 percent).
One caveat for buyers of brand-new homes: Those bidding on newly built homes were among those most likely to make three or more offers before successfully closing (30 percent did, versus 23 percent of existing home buyers).
Most buyers leave neighborhood
More than 40 percent of those who move are relocating to a different city, although 87 percent of all buyers are staying in the same state. Only 17 percent move within the same neighborhood.
Couples are more likely than single-home buyers to stay in their current state (82 percent versus 76 percent).
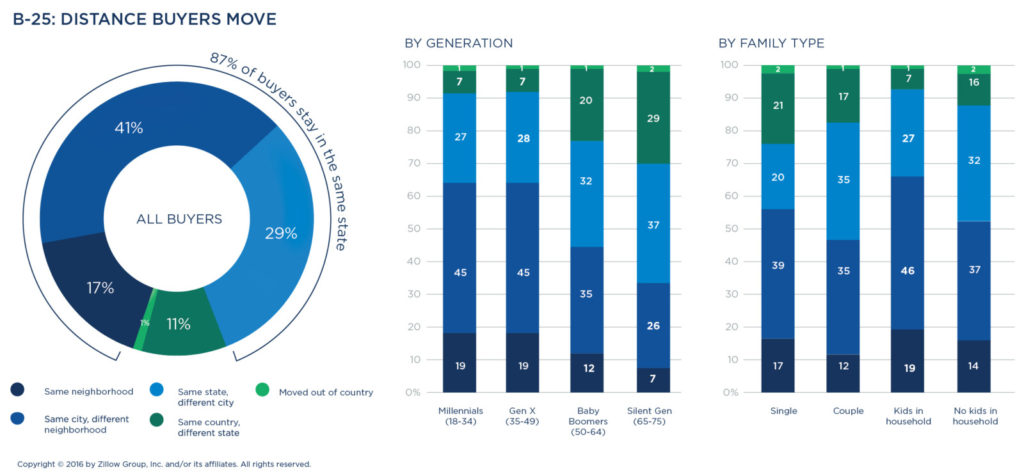
While only 11 percent of buyers are moving out of state, it’s notable that older buyers are more likely to make these long distance moves. While just 7 percent of both Millennials and Generation X are moving across state lines, Baby Boomers and the Silent Generation make such moves 20 percent and 29 percent of the time, respectively.
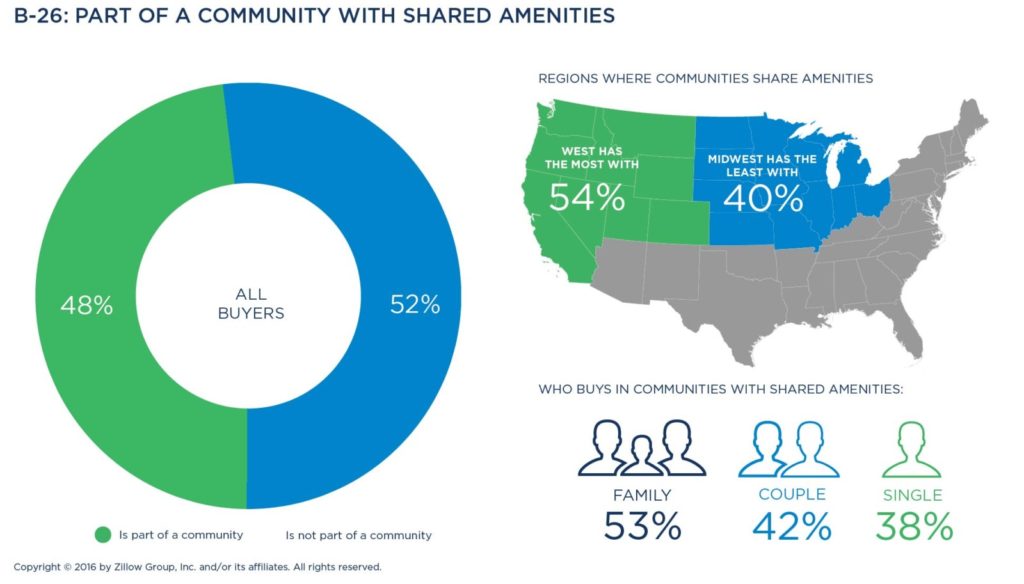
Just under half of buyers (48 percent) bought a house in a community with shared amenities, with Millennials and the Silent Generation leading the way (54 percent and 50 percent, respectively) over Generation X (47 percent) and Baby Boomers (35 percent).
FINANCING & LENDER DECISIONS
 Pre-approval now commonplace
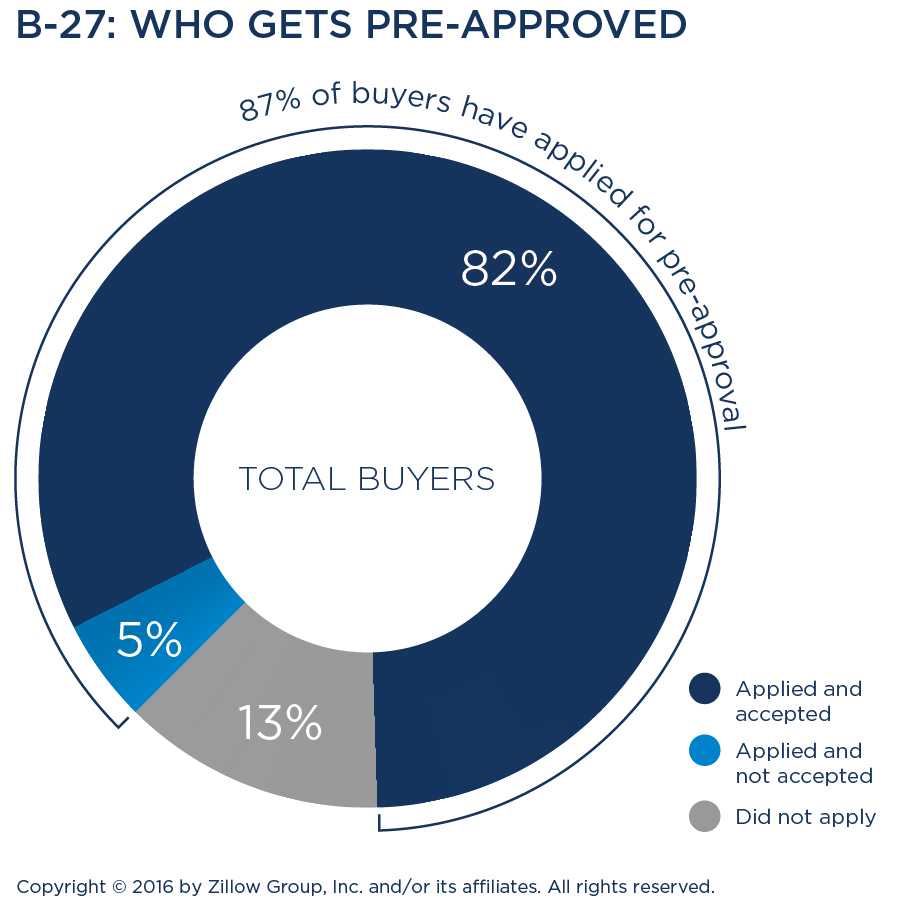
Getting pre-approved early in the buying process has become more commonplace. Eighty-two percent of buyers get pre-approved, with 77 percent getting this pre-approval from a lender before finding a home on which they are interested in placing an offer. An additional 5 percent of buyers applied to get pre-approved but were denied, and 13 percent did not apply for pre-approval at all.
Millennials, Generation X and buyers who engage agents early in the shopping process are more likely than their counterparts to get pre-approved.
Financial tools a helpful first step
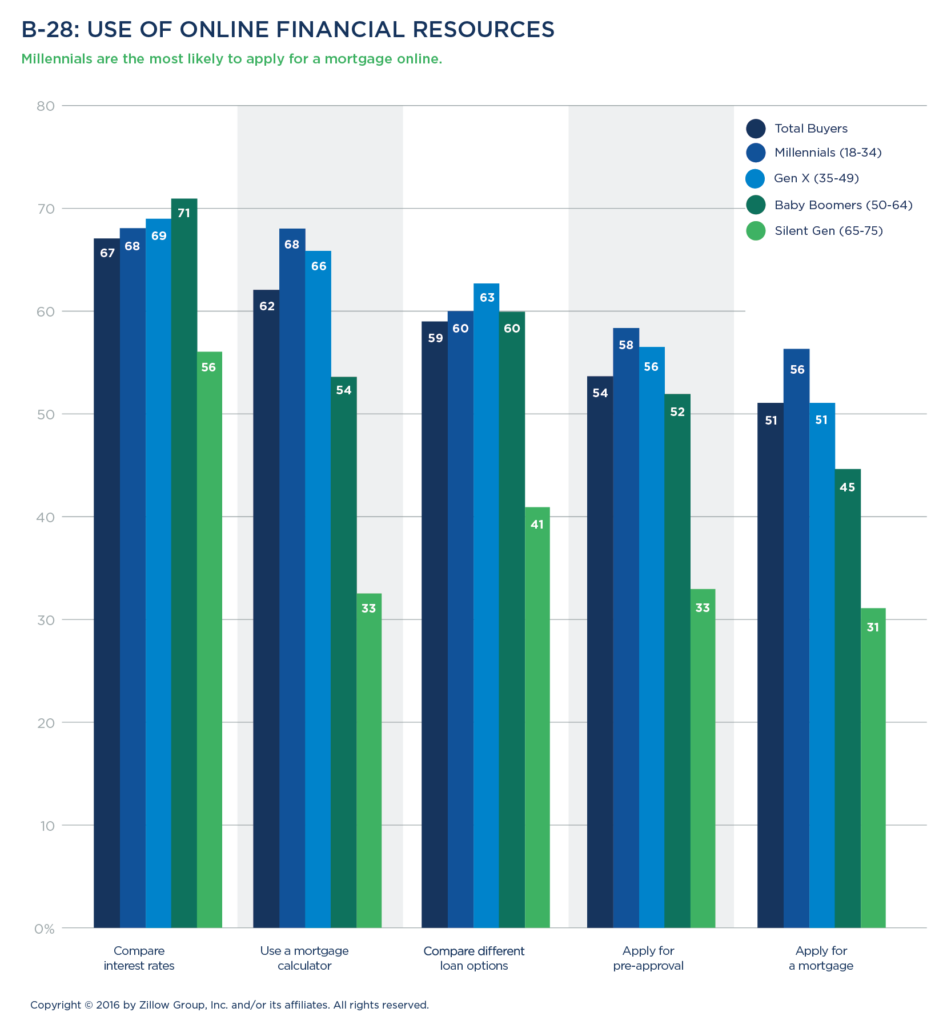
 Buyers model their financing options with the help of online mortgage calculators (62 percent) as well as comparison shop for lower interest rates online (67 percent). Fifty-four percent of those who seek pre-approval do so online and 51 percent of home buyers apply for their final mortgage using an online application. Millennials are the most likely generation to use an online mortgage application (56 percent).
Majority of buyers get a mortgage
Buying a home is a major investment, and 77 percent of all home buyers use a mortgage loan to finance a home purchase, meaning they make a down payment for a portion of the home’s value and then borrow the remaining money needed to purchase the property at the agreed-upon sale price.
Buyers in Generation X (82 percent) are the most likely to finance their home with a mortgage, while Millennials (78 percent), Baby Boomers (72 percent) and the Silent Generation (68 percent) are slightly less likely to finance their home with a mortgage. Only 23 percent of all buyers bought their home without mortgage financing. Those more likely to have paid cash include singles (41 percent) and families without children in the household (27 percent, compared to 18 percent of those with children).

Over half of home buyers (56 percent) save up the old-fashioned way, by socking away cash over time, in order to buy a home. Even so, almost a third (32 percent) rely on two or more sources of cash for their down payment.
Among all buyers, just under one in five received financial gifts (17 percent), sold securities (15 percent), withdrew from retirement funds (14 percent), or took personal loans from family or friends (11 percent) to generate a down payment.
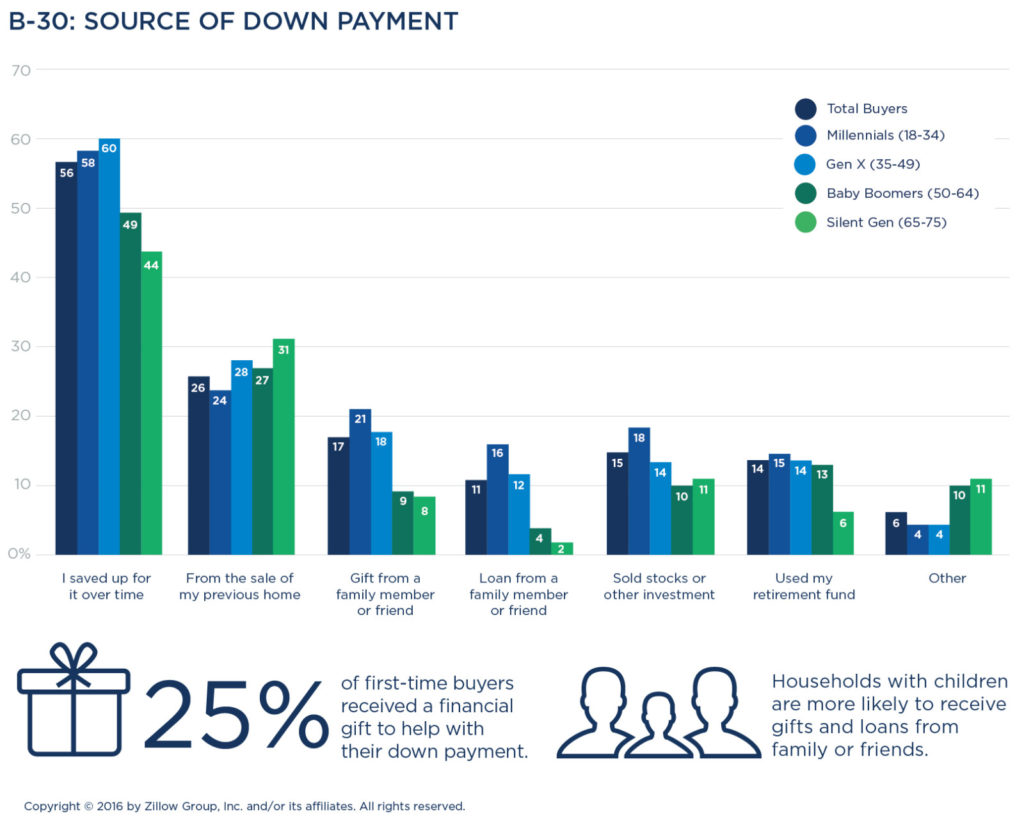
First-time buyers are more likely to finance a home purchase with a mortgage (84 percent), while repeat buyers are slightly less likely (71 percent) to finance their purchase. First-time buyers more often received money as a gift from a family member or friend, with 25 percent using gifted funds as a down payment; otherwise, they too (59 percent) saved the old-fashioned way.
 One lender for both pre-approval and mortgage
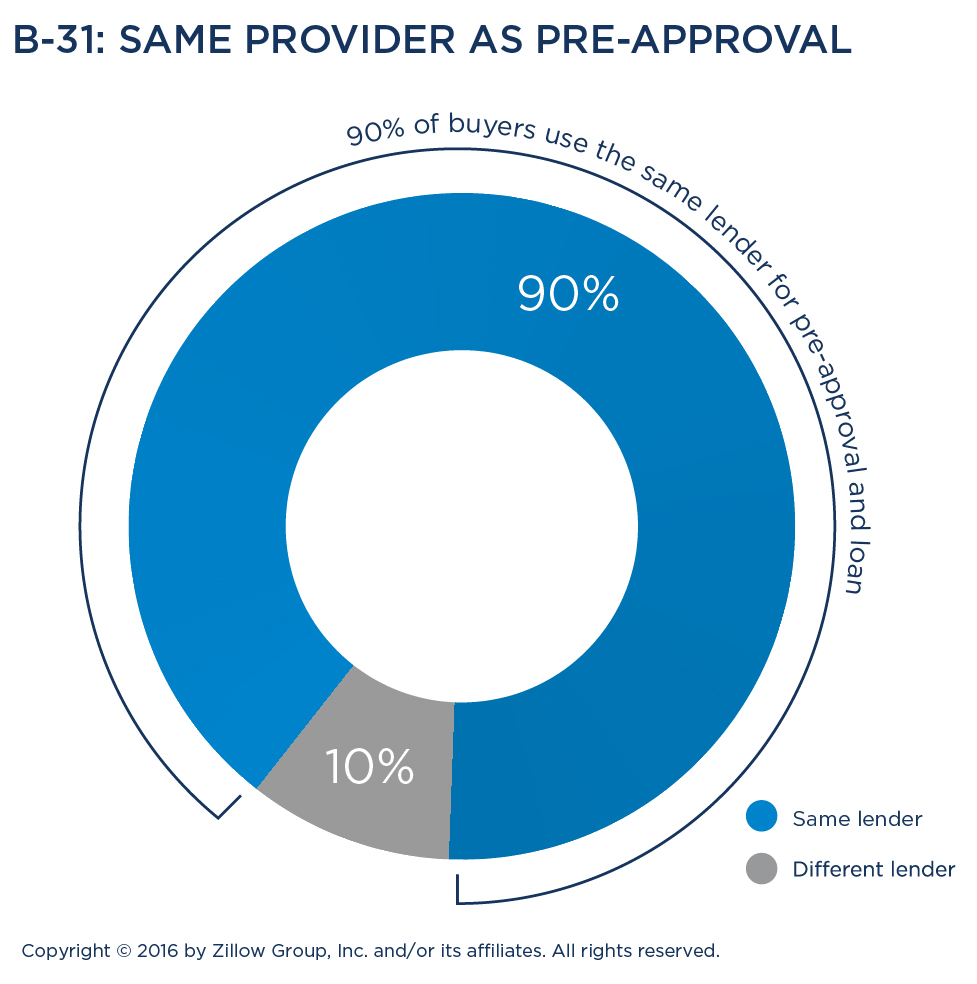
When it comes to finding a lender, 90 percent of buyers used the same lender for both pre-approval and a final mortgage loan. Buyers who got mortgages turned to their agents and the internet to investigate financing options.
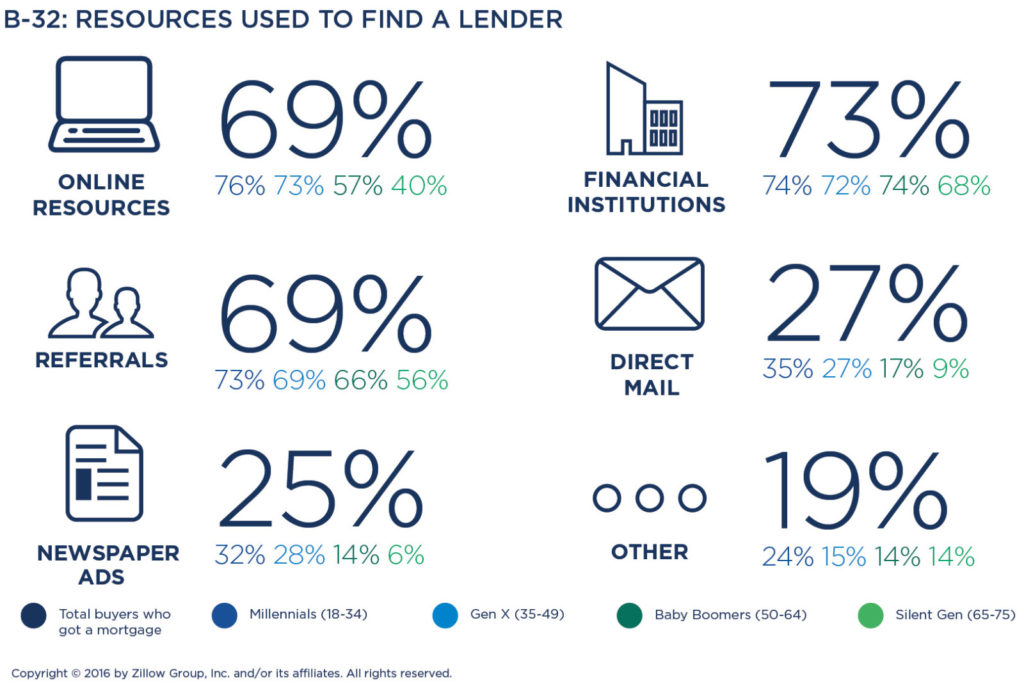 Sixty-nine percent of buyers used referrals from an agent or other trusted person to find a lender, while 69 percent of buyers said they consulted online resources, including search engines (46 percent), real estate sites (43 percent), and personal finance sites (45 percent). Millennial buyers and those in the Northeast and West, as well as households with children, were slightly more likely to use online resources to locate a lender.
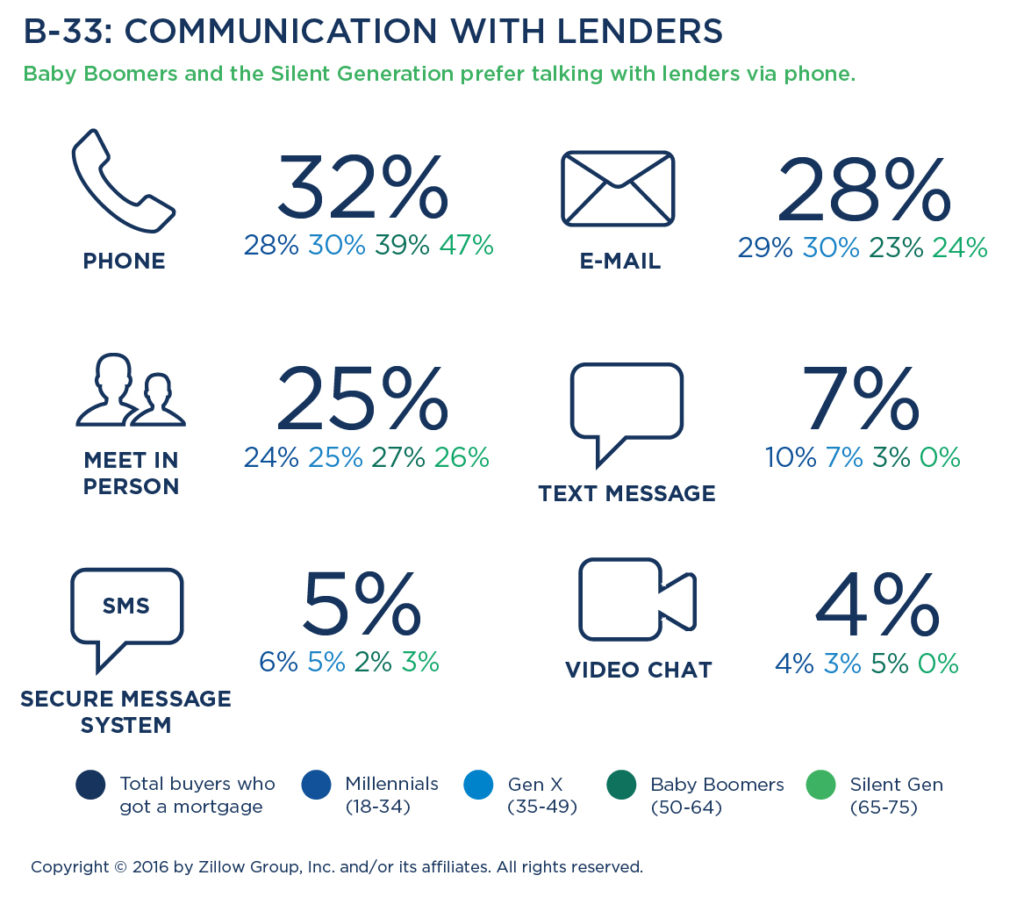
Buyers consider live dialogue an important part of the borrowing process, preferring to hold financing discussions by phone call (32 percent) or meeting in person (25 percent) over messages via email (28 percent) or text (7 percent), with Baby Boomers and the Silent Generation, in particular, preferring a phone call. Millennials were slightly more receptive (10 percent) to texting than older generations.
Buyers contact an average of two lenders when researching home financing options. Older buyers are the most likely to contact just one lender, mirroring their behavior with hiring an agent.

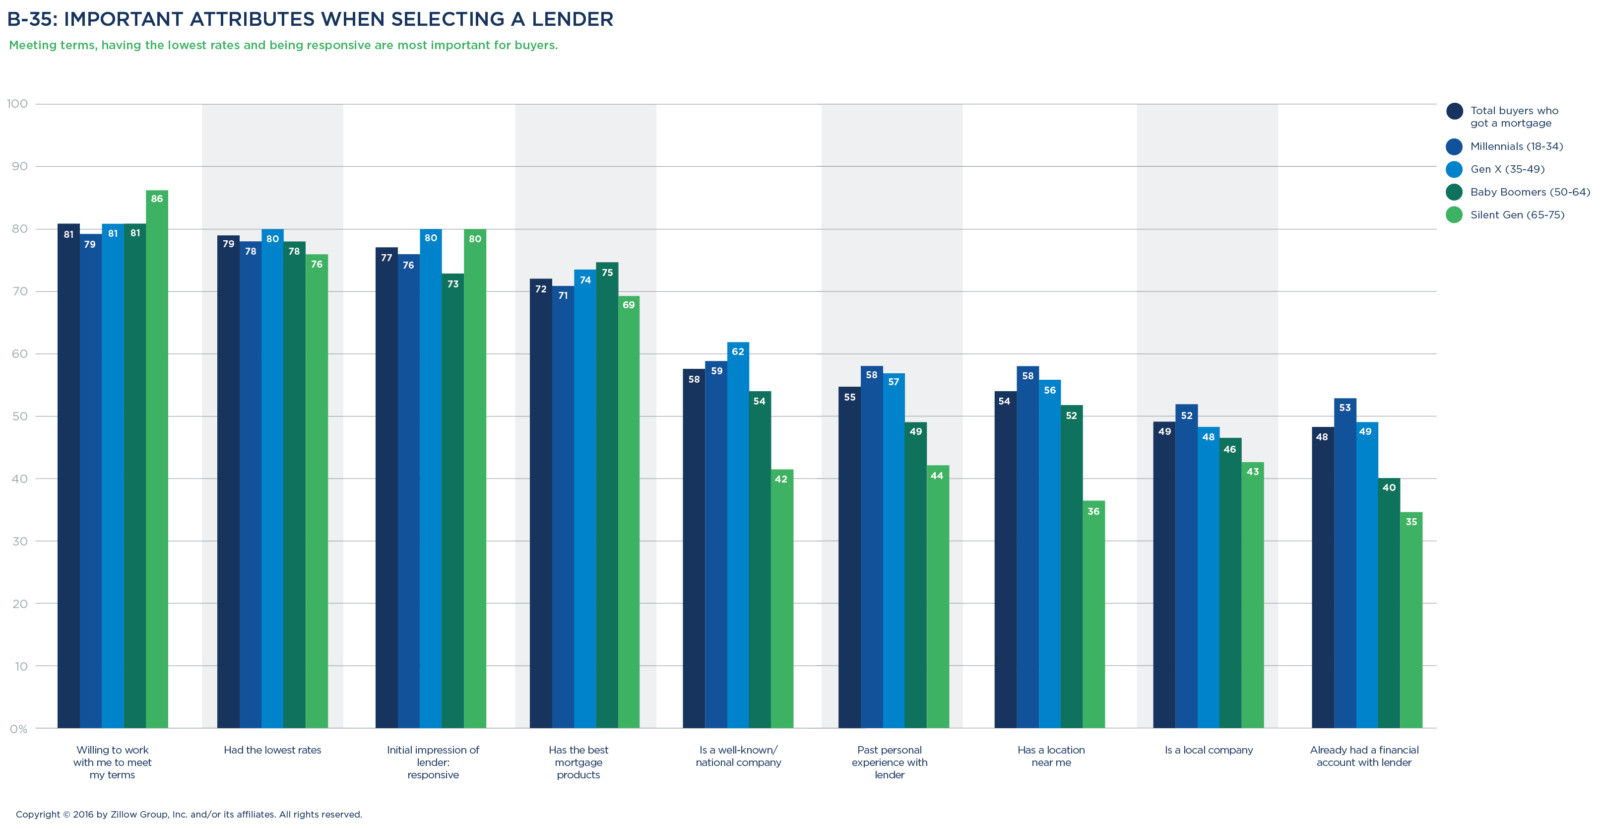
Buyers consider a lender’s willingness to work with the buyer to meet their terms as the most important factor (81 percent) when deciding where to obtain a mortgage loan. Also important are offering the best loan rates (79 percent) and being responsive (77 percent). These traits were more important to buyers than a lender’s affiliation with a well-known or national-brand lending company (58 percent).
The Multifaceted Millennial
Millennials, those ages 18-34, account for 42 percent of today’s home buyers, which is more than any other generation. Members of this large demographic, who grew up in a digital age and entered adulthood during the housing recession, approach home buying and selling with financial savviness and caution.
In many ways, Millennials take a less traditional approach to home shopping—they prefer to begin the process online and are more willing to consider renting instead of buying than older generations.
That said, Millennials’ aspirations about homeownership often mirror the more conservative view of their parents or grandparents. They believe in the power of a home as a financial investment just as much as older generations do, put more weight in online reviews of agents and lenders, and remain incredibly loyal to the professionals and peers that helped them through the process.
Importance of home and community
Unlike older generations, Millennials under 25 are the most likely to see their home as a reflection of themselves rather than a financial investment. Millennials are also the generation that is most community-minded, with more than half (55 percent) characterizing themselves as involved in their neighborhood and other local surroundings.
Millennials, affluent or otherwise, are delaying many life milestones that precede homeownership, such as completing their education, getting married or starting families, and thus are renting deeper into adulthood. Two-thirds of Millennial buyers (66 percent) concurrently consider renting while shopping for a new home, with one in three Millennials seriously considering it (34 percent).
When Millennials do become homeowners, they leapfrog the traditional “starter home” and jump into the higher end of the market by choosing larger properties with higher prices, similar to homes bought by older buyers. They pay a median price of $217,000 for a home—more than Baby Boomers, and just 11 percent less than Generation X. The Millennial median home size is 1,800 square feet, similar in size to what older generations buy.
Not just urban dwellers
It’s a common myth that all Millennials are short-term buyers seeking homes in trendy, urban neighborhoods. In reality, just one quarter of Millennial homeowners live in an urban area. Nearly half of all Millennials live in suburban communities, with eight in 10 adults under 25 living outside an urban core.
More than half of all Millennial buyers (54 percent) purchase a home within a community that has shared amenities—a feature found in newer neighborhoods as well as larger condo complexes or buildings.
The impact of technology
Millennials comprise a disproportionately high share of first-time home buyers, but they make up for their inexperience with research. Millennials use more resources to educate themselves and research agents and lending professionals more than any other generation.
This generation is very familiar with online resources and uses them. Nine out of 10 turn to the internet and eight in 10 use mobile devices or apps to help with the home-buying process. On average, Millennial buyers and sellers use at least three online resources; one in four (28 percent) use five or more online resources. They also turn to the internet to model financial scenarios, with more than two out of three Millennial buyers who have a mortgage using interest rate and affordability tools and mortgage calculators.
Millennials also contact more agents—at least two when buying, at least three when selling—than any other generation. Millennials look online for authentic information about experiences from peers, as evidenced by more than six in 10 reading agent reviews before choosing an agent.
Conversations matter
While Millennials lean heavily on technology to gather information early in the buying or selling process, it doesn’t replace important conversations. And though Millennials are accustomed to texting, that’s not their favorite way to interact with agents or lenders.
Millennial buyers prefer talking to their agent on the phone (30 percent), with fewer than one in six (16 percent) preferring to text with their agent. One in four (24 percent) likes meeting their agent in person, a preference mirroring Baby Boomer consumers.
With lenders, Millennial buyers prefer phone calls. One quarter (24 percent) of Millennials like meeting with their lender in person, also resembling older generations. Only one in 10 Millennials wants to text with a lender—meaning that when it comes to real estate, they only favor texting slightly more than Generation X (7 percent prefer texting).
The value of expertise
Although Millennials are more likely to rely on online resources, they also greatly value professional advice. The majority of Millennials work with agents, although by a smaller margin than older generations. When they enlist an agent they do so earlier in the home-search process, shop for a home faster than most older generations, and are more likely to stay in touch with an agent—and refer their agent to friends—than members of any other generation.
When they find a professional they trust, Millennials are extremely loyal. More than half (55 percent) of Millennials have recommended their agent to others, and more than one quarter (26 percent) have left an online review of their agent. In addition, 40 percent stay in touch with their agent, turning to a real estate professional for home improvement advice almost twice as often as Generation X and more often than other older owners.
Today’s Home Seller
The majority of today’s home sellers are listing a home for the first time and are usually embarking on the process amid a life change, such as a job change, divorce or becoming an empty nester. Millennial and Generation X sellers are looking for more space, while older sellers are often downsizing. On average, sellers upgrade with an additional 100 square feet and a 11 percent more expensive home.
Eighty-eight percent of sellers rely on a real estate agent to guide them through the sale, and 83 percent make sale-related improvements or renovations—a strategy that pays off with an offer above list price. When selecting an agent, sellers rate local market knowledge and responsiveness as top considerations.
SELLER CHARACTERISTICS & CONSIDERATIONS
Sellers are educated, married and new to selling
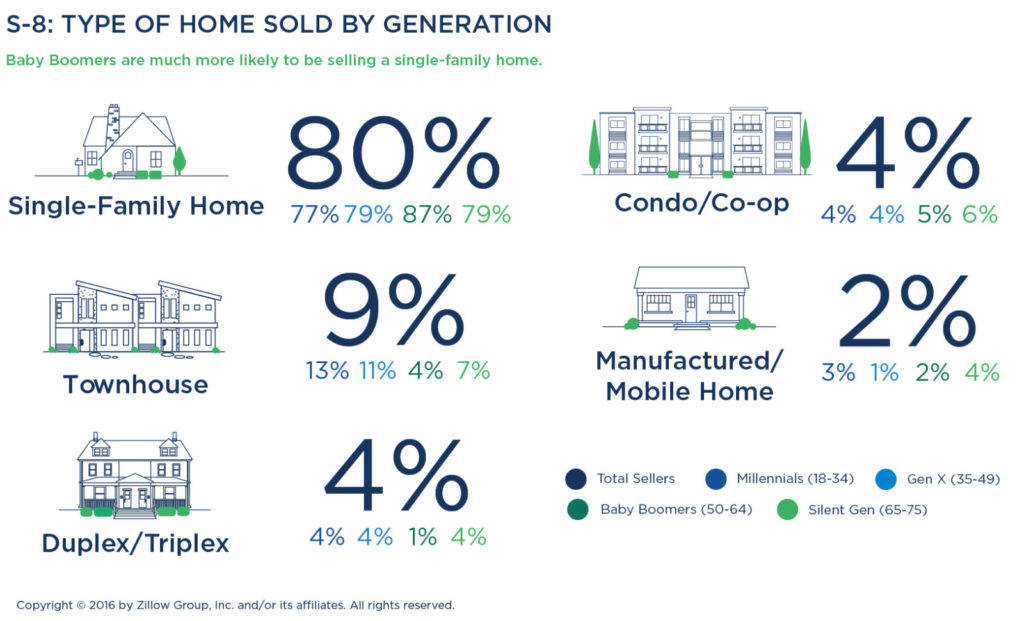
The typical home seller is most often college-educated (79 percent), married (71 percent), with a median age of 41 and a median household income of $87,500. Eight in 10 (80 percent) are selling a single-family home, 9 percent are selling a townhouse, with the remaining sellers looking to sell a condo/co-op (4 percent), duplex/triplex (4 percent) or a manufactured/mobile home (2 percent).
In terms of diversity, nearly three-quarters of all sellers (72 percent) are Caucasian, with Latinos/Hispanics representing nearly 11 percent of sellers. Nine percent of sellers are black/African-American, and 6 percent are Asians/Pacific Islanders.

The biggest group of home sellers belongs to Generation X (38 percent). A quarter of home sellers are Millennials (26 percent). Eighteen percent of sellers are Baby Boomers, and 19 percent are from the Silent Generation.

 Most are first-time sellers
The majority (63 percent) of people putting homes on the market are doing so for the first time. Twenty percent report having sold one home previously, and an additional 17 percent indicated they have sold multiple homes. First-time sellers have a median age of 36, while repeat sellers are older, with a median age of 60.
Home selling a shared role
Sellers aren’t in it alone: most are sharing the role of selling. Eight out of 10 sellers are sharing the role of selling with at least one other individual, including a spouse/partner (61 percent), roommate or friend (22 percent), or another family member (15 percent).
Life events often a trigger
The decision to sell a home is generally prefaced by at least one of several life events that happen during the 24 months leading up to a sale. These most often include job changes and promotions (26 percent), shifts in financial status (24 percent), retirement (16 percent), or changes to the number of people in a household due to a birth, death, marriage, divorce, becoming empty nesters, or other factors.

Many are also buying
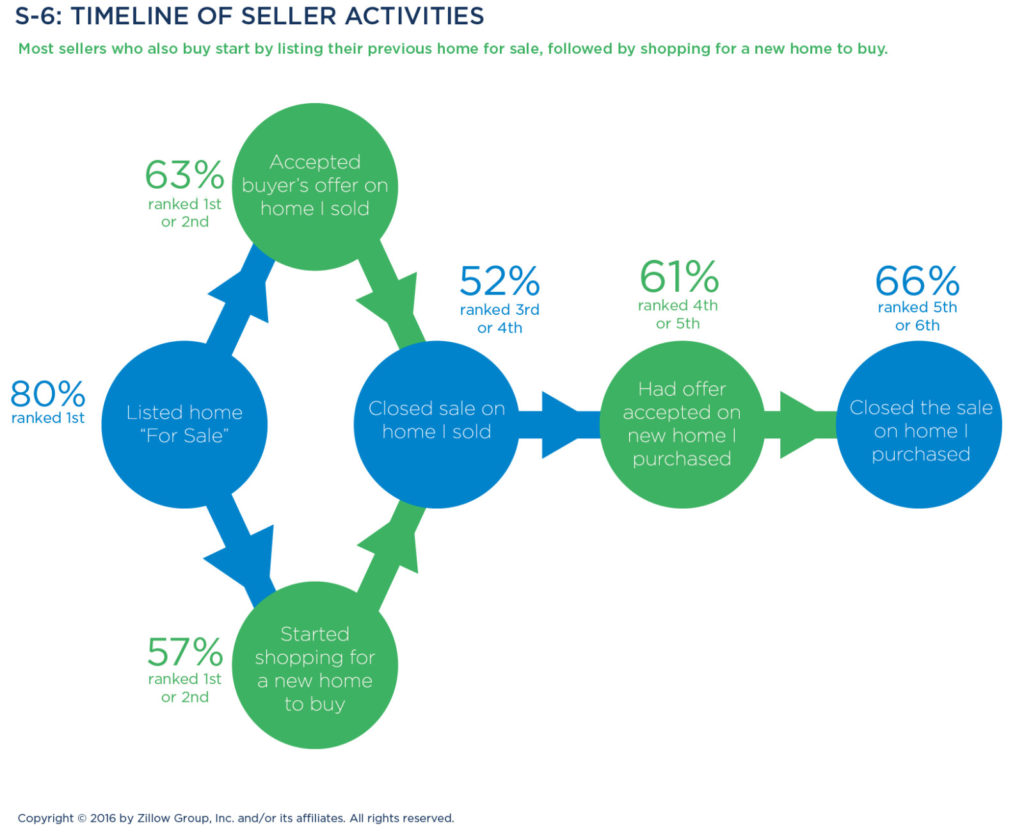
Many sellers are also likely to have the additional challenge of looking to purchase their next home. More than eight in 10 sellers (80 percent) moved to a home they purchased. Generation X (85 percent) and Millennials (83 percent) are the most likely to be “dual trackers”—both selling and buying—with 73 percent of Baby Boomers and 74 percent of the Silent Generation also buying.
These dual-track buyers and sellers typically elect to list their previous home as their first step. Some sellers wait until they accept an offer on this home, while others embark on their search for a new home to buy as their next step. Once their previous home closes, most sellers extend an offer on a new home, ultimately completing their process by having their offer accepted and closing on the sale of their new home.
Sellers are typically exiting their current home and upgrading to a larger or better-finished space. Among those buying a new place, they’re typically purchasing a home with an additional 100 square feet (from 1,900 square feet sold to 2,000 square feet bought) that costs about 11 percent or $25,560 more than the home they listed.
Generation X and Millennial buyers in particular are seeking more space—23 percent and 25 percent more square footage. Baby Boomer buyers largely remain in the same size home, while the Silent Generation tends to downsize to a smaller home, reducing by an average of 220 square feet.

LISTING & SELLING PROCESS
 The average home for sale
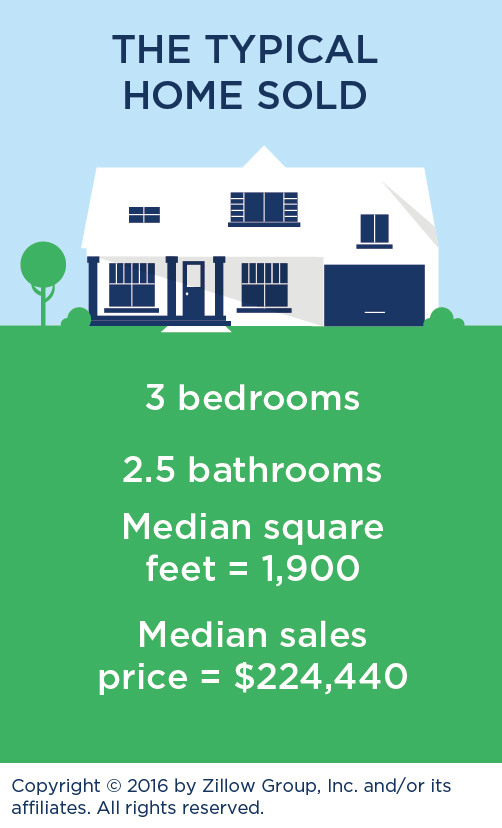
The typical home for sale today is a 1,900-square-foot house, with 3.1 bedrooms and two full bathrooms, one half bathroom, and a median sales price of $224,440. Most properties sold are single-family houses (80 percent), followed by townhouses (9 percent), condos/co-ops (4 percent), and duplex/triplexes (4 percent).
Homes sold over the past year vary significantly by region. The typical home in the Midwest and Northeast is about 10 years older than the typical home in the rest of the country. The Northeast—with a disproportionate share of condos and co-ops—has some of the smaller homes in the country, with a median size of 1,680 square feet.
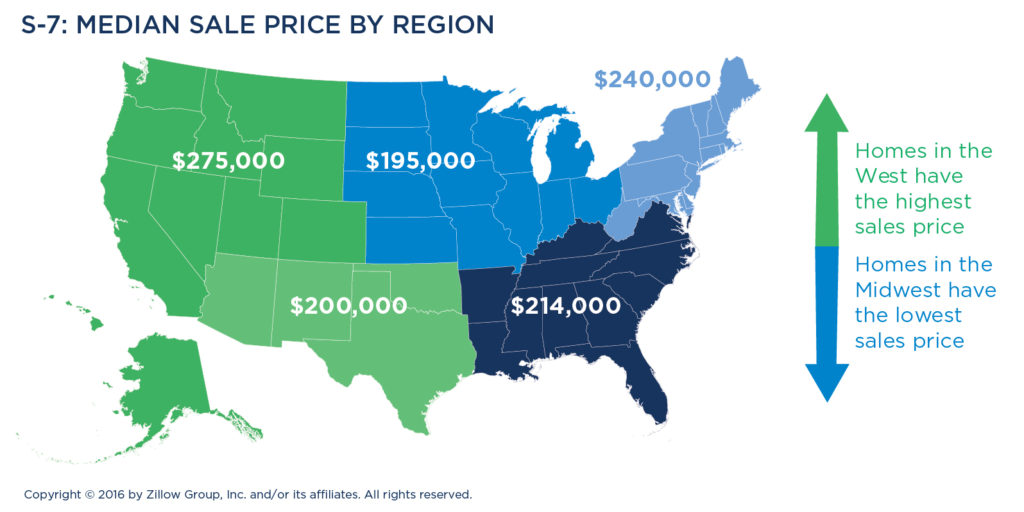
Homes sold in the West (typically 1,730 square feet) and Midwest (with a median size of 1,900 square feet) are slightly larger. Homes for sale in the Southeast and Southwest are typically among the largest in the country (with a median size of 1,987 and 2,000 square feet, respectively). They vary significantly on price, as well. Homes in the West carry the highest median sales prices ($275,000), while homes in the Midwest are the least expensive ($195,000).
Along racial and ethnic lines, Latinos/Hispanics have the highest median sales prices at $250,000, compared to Asians/Pacific Islanders at $236,640, $225,000 for Caucasians, and $200,000 for blacks/African-Americans. Latinos/Hispanics tend to sell homes with a larger footprint than other groups, with an average square footage of 2,100. Blacks/African-Americans sell homes with an average square footage of 1,950, compared to 1,940 for Asians/Pacific Islanders, and 1,800 for Caucasians.
Baby Boomers tend to sell the largest homes, with a median square footage of 2,100 square feet, which is 200 square feet larger than the typical home sold. They are also the most likely generation to be selling a single-family home (87 percent). One in five Millennial sellers (20 percent) have been living in a footprint of less than 750 square feet, compared to only 12 percent of Generation X sellers and virtually no Baby Boomers (1 percent) or Silent Generation (3 percent) sellers. Millennials are also more likely than older generations to be selling a townhouse (13 percent).
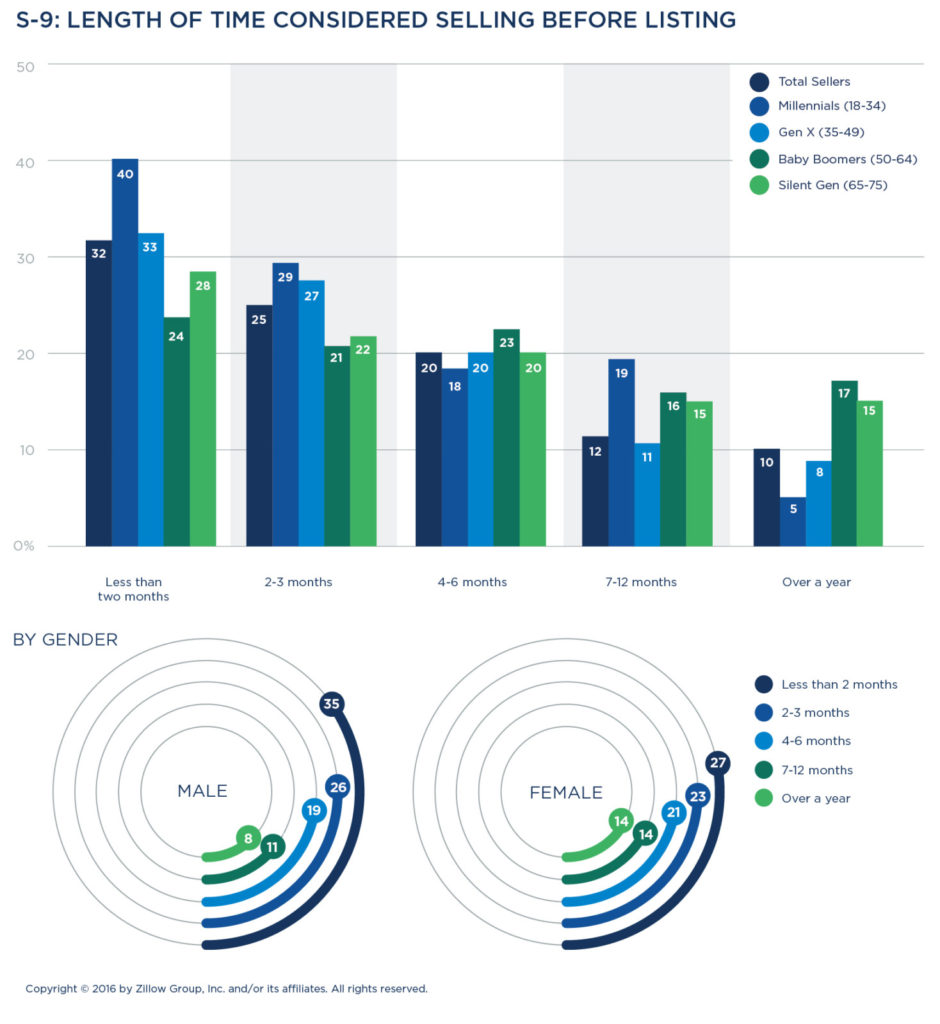
Deciding to sell takes nearly five months
Sellers consider putting their home on the market for 5 months on average before they list it. Millennials spend the least time planning to sell (average of 3.7 months) while Baby Boomers (6.5) and the Silent Generation (6.1 months) spend significantly longer deciding. Women spend more than five weeks longer considering selling than men (5.9 months versus 4.6 months). Sellers who closed above listing price tended to be people who spent less time deliberating (2.4 weeks less than average) about whether or when to put a home on the market.
Home improvements are first step
Most sellers spend money to make money, investing in an average of 3.1 improvements to their property before listing. More than eight out of 10 sellers (83 percent) make improvements or renovations to prepare their home for sale. The most common repairs include painting the interior or exterior of the house (45 percent), renovating the bathroom (31 percent), bolstering curb appeal (27 percent), landscaping (24 percent), and adding new carpeting or flooring (26 percent).
Repair efforts varied by household composition, with more than a quarter (28 percent) of single sellers making no improvements, versus 23 percent of couples and 11 percent of families opting not to make changes to their property.
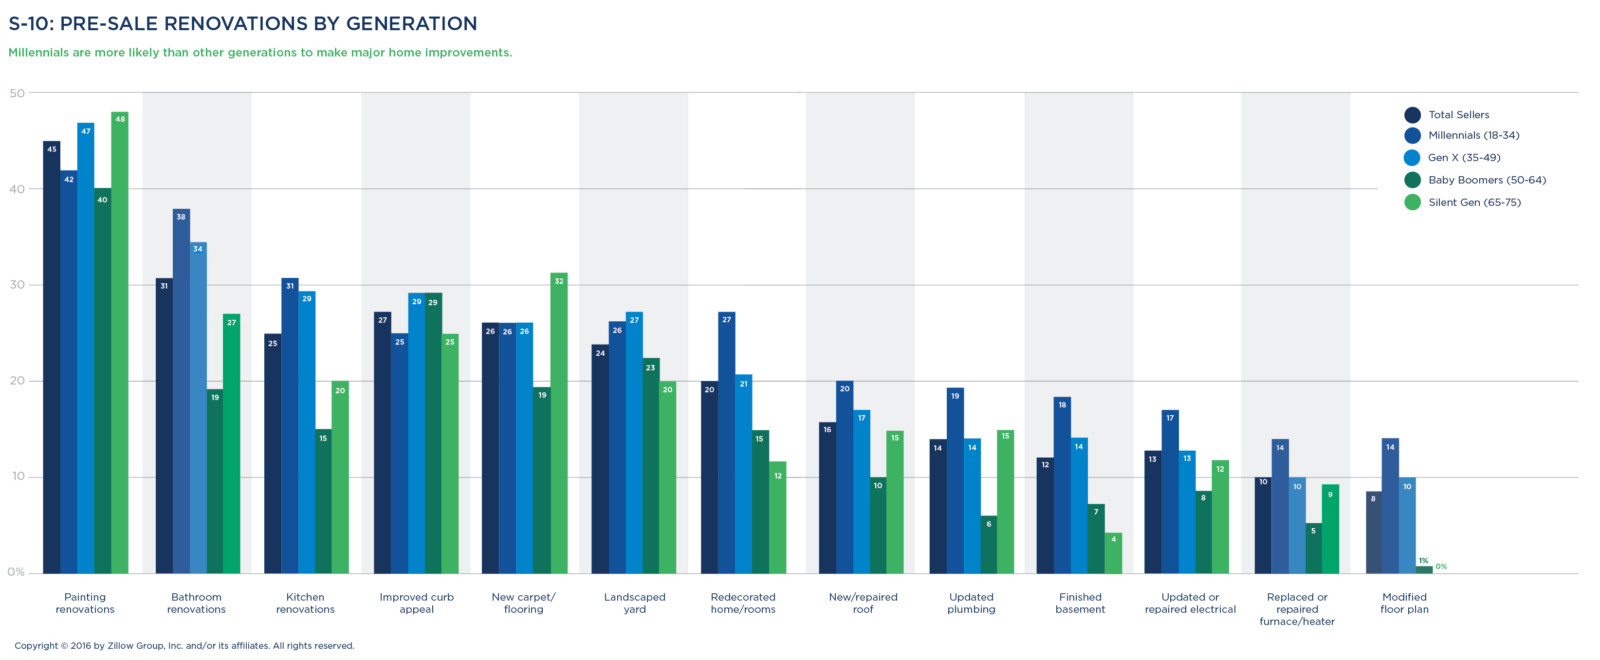
Generationally speaking, Millennials were much more likely (92 percent) than Baby Boomers (75 percent) and the Silent Generation (72 percent) to make major home improvements to spur a sale, including labor-intensive tasks such as finishing basements (18 percent), renovating bathrooms (38 percent) and changing a home’s overall floor plan (14 percent).
Baby Boomers and the Silent Generation are the generations least likely to make any major improvements to a home to prepare the home for sale: More than 25 percent of older owners opted out of making home improvements, whereas 13 percent of Gen X and 8 percent of Millennials owners made none. Instead, Baby Boomers and the Silent Generation are choosing to make improvements over the course of owning their home, making updates predominately to meet their style preferences.
Getting ready to list
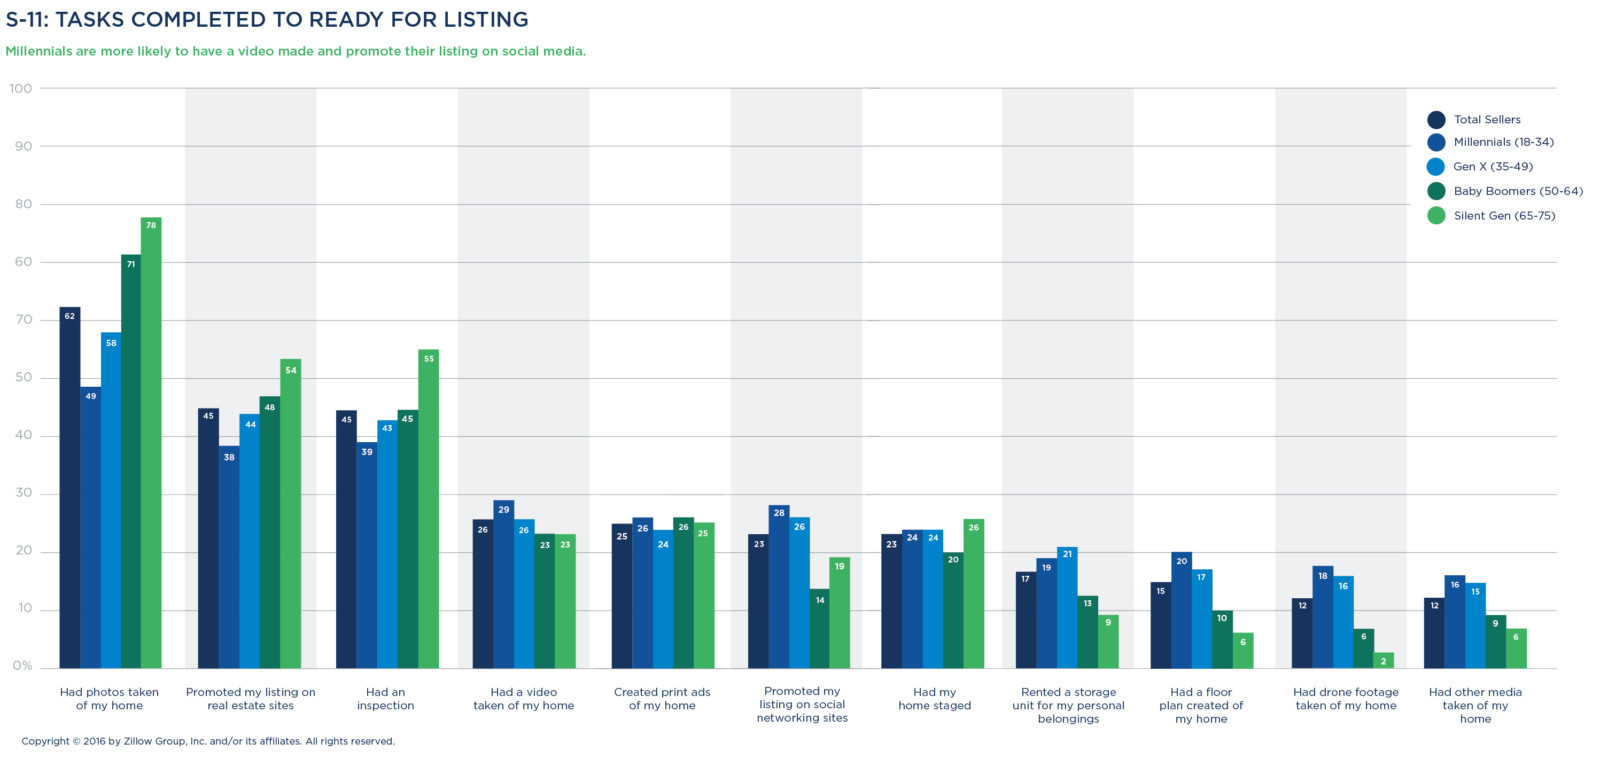
Sellers complete an average of three activities connected to their home’s listing, some of which are at an agent’s recommendation or part of their services. These most often include photographing the home (62 percent), promoting the listing on real estate sites (45 percent), and conducting a pre-inspection (45 percent) to help with pricing and predict queries from buyers about home issues.
The younger the seller, the more interactive their marketing preferences. Millennials are more likely to have video footage taken of their home (29 percent versus 23 percent of Baby Boomers) and to promote their listing via social media sites like Facebook (28 percent versus 14 percent of Baby Boomers).
Silent Generation sellers are most likely to have photographs taken of their home (78 percent), have their listing promoted on online real estate sites (54 percent), and have a pre-listing inspection conducted (55 percent).
Activities while on the market
However well-laid the plan, the sale plot often has numerous twists and turns—failed offers, market withdrawals, and price adjustments or negotiations. On average, it takes around three months (2.8) from initial listing to closing on a home sale.
Sellers hold an average of two (1.9) open houses, pull their home off the market once (0.8), receive between two and three offers (2.5), and see about one offer fall through.
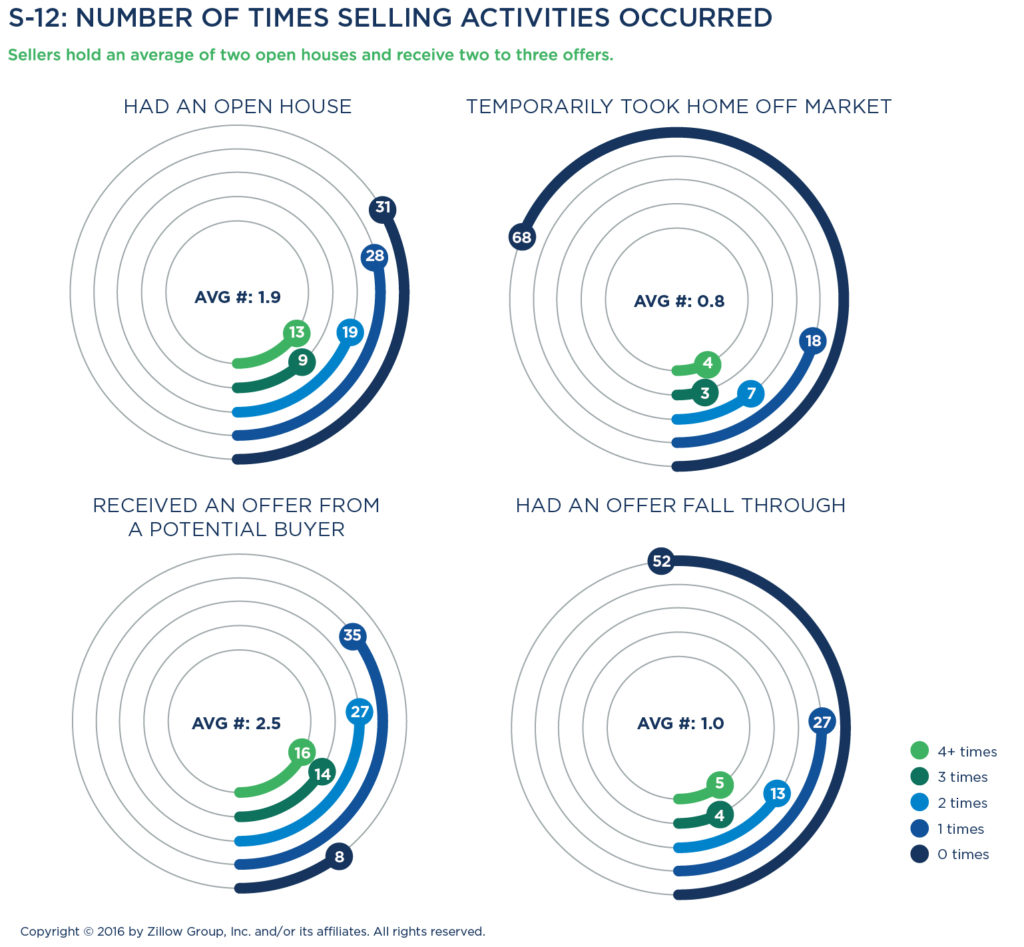
 In contrast, sellers who sell above list price are more likely to hold at least one open house, take their home off the market once, and receive three or more offers (but typically see one or two fall through). Sellers who sell above list price also typically complete more selling-related renovations and improvements to their home. Given that local markets shift and change from year to year, past selling experience is no guarantee that a homeowner will fetch above list price: Only 47 percent of repeat sellers sell at or above list price, whereas 54 percent of first-time sellers did.
Two-thirds (66 percent) of sellers change their list price at least once, but less than half (39 percent) change the price two or more times. Millennials are disproportionately likely (80 percent) to change their list price at least once, while Baby Boomer sellers are the most likely to hold the line on a listing price (46 percent made no change).
Gauging buyer interest is key
There are a variety of methods that sellers indicate are important ways to gauge interest in their home while on the market. They include:
- Getting feedback about their home and what changes could be made to potentially sell it faster or at a higher price (69 percent)
- Knowing how many people have contacted an agent about the home (66 percent)
- Seeing how their home is performing compared to similar homes for sale (65 percent)
- Knowing how many people have looked at their home online (58 percent)
- Seeing how many people attended one of their open houses (56 percent)
Millennials and Generation X sellers are more likely to place importance on knowing how many people contacted their agent about their home (70 and 69 percent, versus 66 percent for Baby Boomers and 57 percent for the Silent Generation).
Rating the selling experience
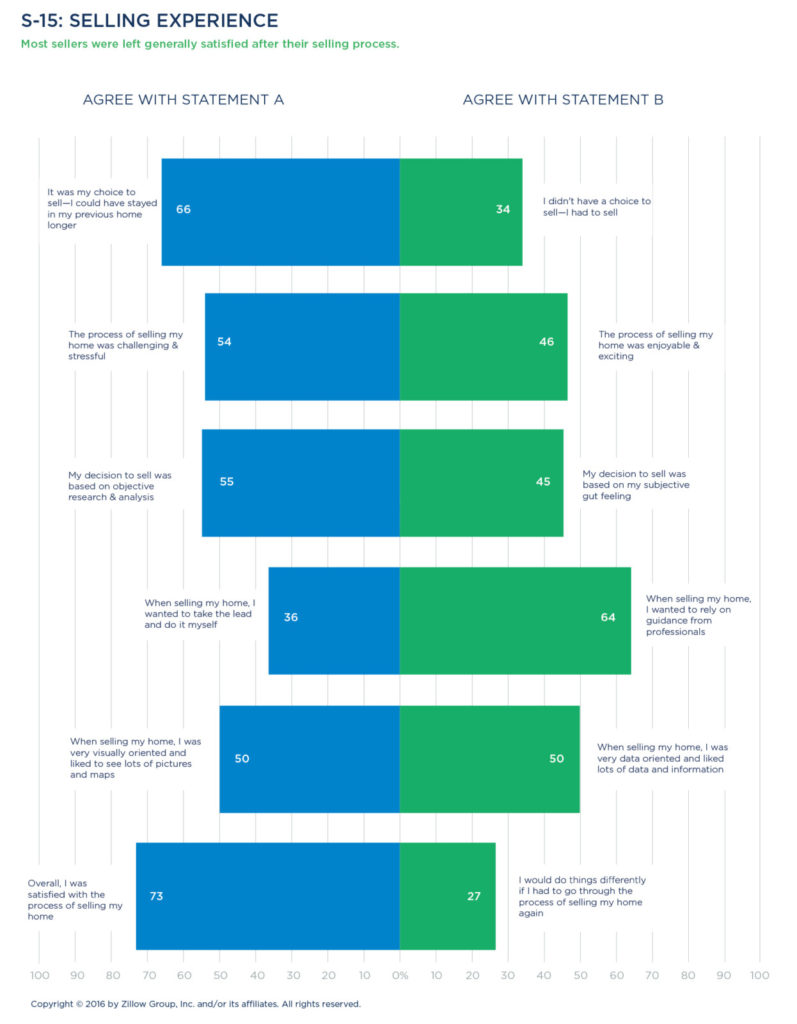
Selling a home is stressful for just over half of sellers, regardless of whether or not they have been through the process before. Both first-time sellers (52 percent) and repeat sellers (57 percent) indicated that putting their home on the market was challenging. And rightfully so—a homeowner’s ability to fetch a desired sale price can have a major impact on household finances and the financing of the next home they may purchase.
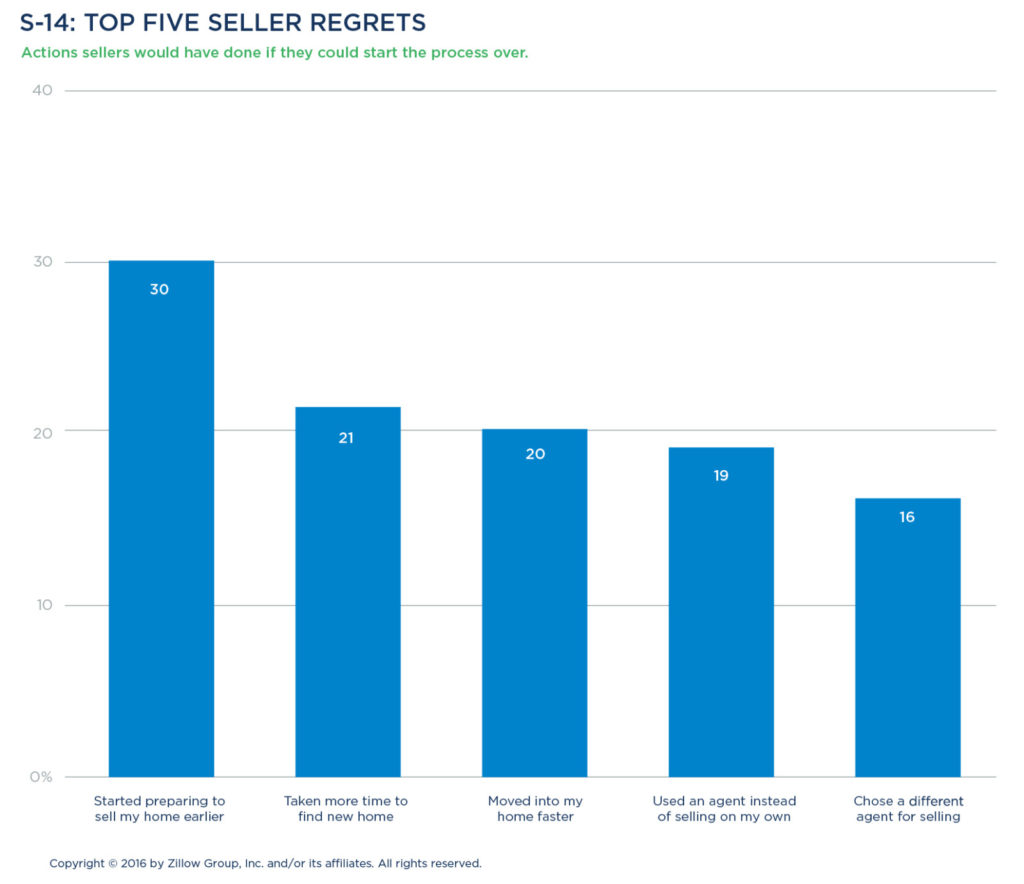
Ultimately though, most sellers (73 percent) were satisfied with the outcome of a sale transaction. Where they had regrets, sellers indicated they wished they’d had more time to prepare their home for sale (30 percent) or worked with a different listing agent (16 percent).
Snapshot: Selling Above List Price—What Works
When it comes time to sell a home, every seller wants the same outcome: To sell quickly for as much money as possible. Sellers who sold for at least 2 percent above list price share several traits. They begin preparing both on their own and with a professional early in the process, they tackle repairs or improvements to cater to prospective buyers, they use a multimedia and digital-rich marketing approach, and they are more likely pull their home off the market or hold multiple open houses.
They planned ahead
Sellers start preparing to sell their home before officially listing by researching on the internet, with nearly three in four (71 percent) turning to online resources such as real estate websites (73 percent) or brokerage listing sites (40 percent). Seventy-three percent reported using social networks, too.
They also use home pricing tools, with 66 percent turning to home price estimate tools, requesting advice from agents or friends (63 percent) or even hiring an appraiser (31 percent).
They enlisted a trusted agent
The vast majority (90 percent) of sellers who sell above list price work with an agent, and two out of three such sellers (58 percent) begin working with an agent at the very beginning of the sale process. Successful sellers vet their agent carefully, with 68 percent saying they considered at least two different agents.
Nearly nine out of 10 sellers (86 percent) placed a heavy emphasis on their first impression of the agent they were considering. Most also looked at an agent’s recent sales (66 percent) and local reputation (73 percent) in evaluating whether the agent could help them sell for top price.
They updated their home
Sellers who fetched above list price tackled expensive and messy renovation projects before selling, rather than passing them on to buyers. These sellers were about 50 percent more likely to modify an existing home plan or finish off a basement than the average seller, and approximately 20 percent more likely to renovate a kitchen or repair a roof. They were 8 percent more likely to complete a bathroom upgrade, too.
They understood that online appeal is the new curb appeal
Sellers who sold for more than list price made imagery and home information available across as many internet media as possible in their quest to market their home. Nearly half (48 percent) had photos taken of their home, three in 10 shot video, and many shared their listing on social media (28 percent), had their home professionally staged (26 percent), or shot drone footage (21 percent) or other types of imagery (18 percent).
They aren’t afraid to take control
Eight-two percent of sellers who ended up selling over list price held at least one open house to draw in potential buyers. That said, if their first approach didn’t draw the attention they were desiring, these sellers weren’t afraid to regroup and try again. Twenty-six percent of those who sold above list price took their home off the market once (compared to 20 percent of all sellers) opting to start anew rather than letting the home languish on the market with minimal activity.
Not all sellers who fetched above list saw bidding wars. One quarter (27 percent) got one offer and then took it, while another quarter (24 percent) received four offers or more. Almost all (86 percent) of above-list sellers went through a buyer’s inspection.
RESEARCH & SELLING RESOURCES
Online resources and agents are key
The vast majority of sellers utilize both an agent and online resources to prepare for and ultimately sell their home. Eighty-eight percent of sellers used an agent or broker, and 68 percent used one or more online resources. Additional resources include consulting with friends, relatives or neighbors (49 percent), print ads (46 percent) and direct mail (37 percent).
Use of resources varies by age
Millennials show a strong preference for using agents (87 percent) and online resources (88 percent) in nearly equal measure, which suggests they are relying on the expertise of a professional in tandem with conducting their own research. Compared to other generations, they are more likely to use mobile devices (73 percent) or apps (66 percent). Millennials also place higher relevance on information from friends, neighbors and family (72 percent) than older generations.
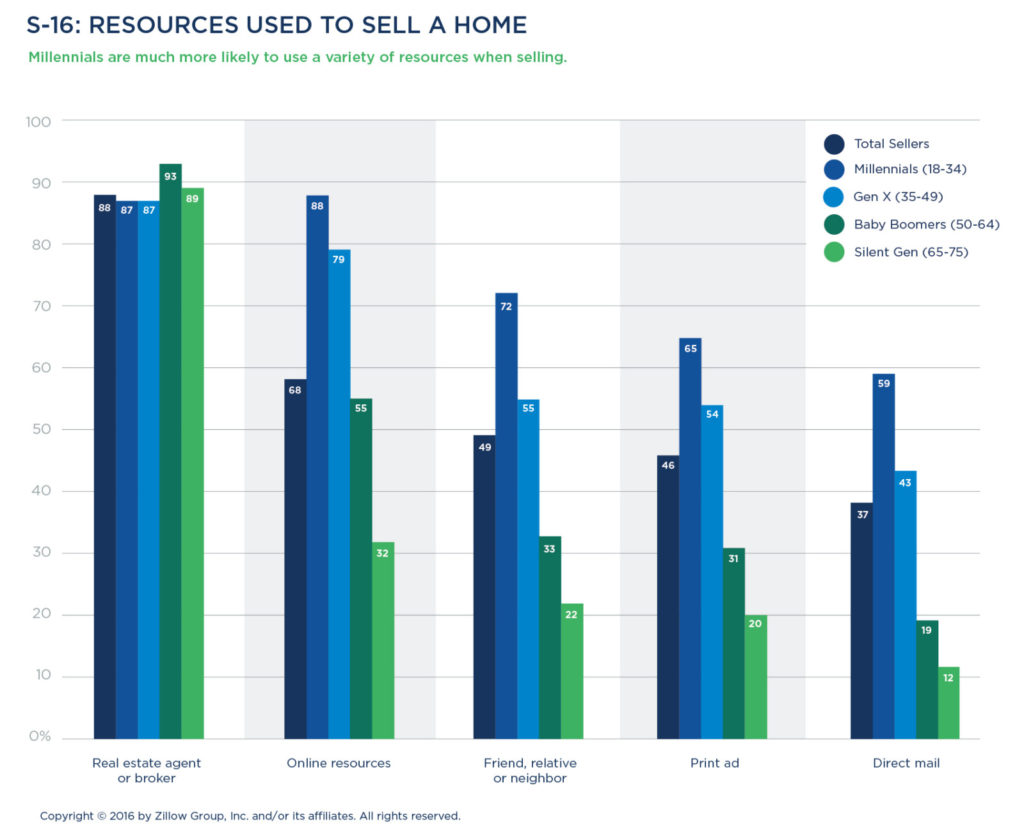
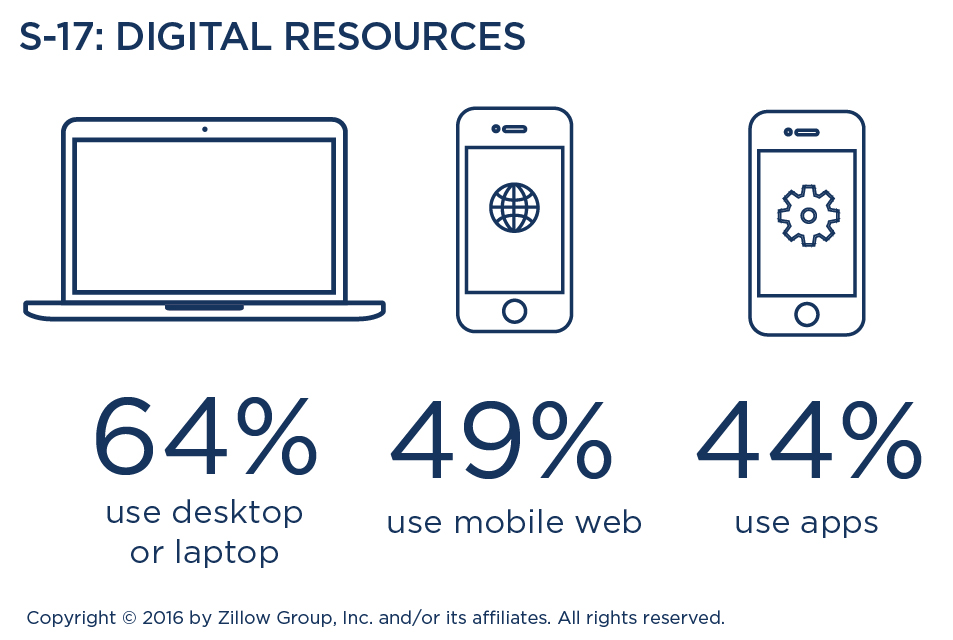 Generation X sellers are similar to their younger counterparts, with 87 percent using an agent and 79 percent using online resources. They are likely to access online resources via a variety of methods including mobile web (59 percent) and apps (54 percent). Personal referrals from friends and neighbors are also fairly common (55 percent).
Baby Boomers are much more likely to defer to a real estate agent (93 percent) than use online resources (55 percent) or information from friends and neighbors (33 percent). Silent Generation sellers defer to an agent or broker (89 percent), doing a little online research (32 percent), with less than one-third of them going to either mobile sources or friends for information. Both Baby Boomers and the Silent Generation are less likely than those under age 50 to utilize print ads (31 percent and 20 percent, respectively) or direct mail (19 percent and 12 percent, respectively) during the process of selling their home.
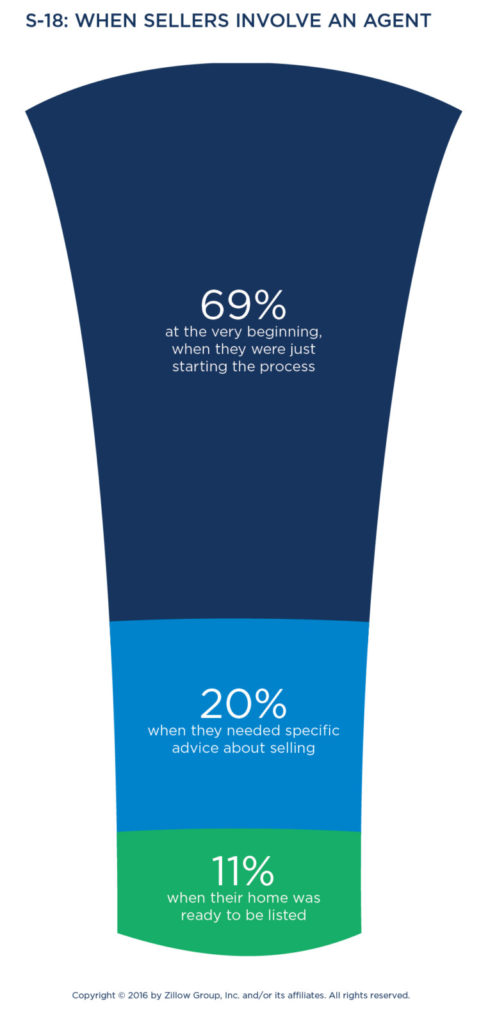 Majority of sellers involve an agent from the start
More than two-thirds of sellers who used an agent (69 percent) chose to involve them at the beginning of their sale planning process. In fact, more sellers are likely to involve an agent at the very beginning than buyers (51 percent involve an agent at the onset of buying). Remaining sellers choose to involve an agent once they need specific advice such as sale timing or listing price (20 percent), with 11 percent waiting until right before listing.
Sellers consider an average of three agents
Slightly more than half (51 percent) of sellers using an agent consider multiple agents, with 26 percent choosing from two, and 25 percent considering three or more. Similar to trends seen with buyers, the likelihood to consider multiple agents varies depending upon the age of the seller. Sixty-four percent of Baby Boomers consider only one agent, compared to 53 percent of the Silent Generation, 46 percent of Generation X, and just 38 percent of Millennials.

 The most common ways that sellers find the agent they end up selecting are referrals (24 percent), online sources (18 percent) or past experience with the agent (17 percent). Millennials are most likely to find their agent via an online resource (24 percent), while Generation X and Baby Boomers are most likely to find their agent via a referral (27 percent for both).
Among sellers who are also buyers, repeat use of the same agent is fairly common. Fifty-five percent of these sellers used the same agent to assist with the sale of their previous home and purchase of their new home. Those most likely to use the same agent for both transactions are Millennials (72 percent) and Generation X sellers (69 percent), compared to 52 percent of Baby Boomers and just 22 percent of the Silent Generation. Thirty-three percent of sellers who also purchased a new home elected to use a different agent, and 12 percent elected to not use an agent for their new home purchase.
Local market knowledge and a positive first impression are vital
Similar to a buyer’s search for an agent, sellers seeking an agent go with their gut and seek out someone whom they feel they can trust (82 percent), who possesses local market expertise (84 percent) and who is responsive (82 percent). Additionally, sellers place weight on an agent’s reputation in the neighborhood (74 percent), a recent track record of successful sale closings (72 percent) and, to a lesser degree, online reviews (54 percent).
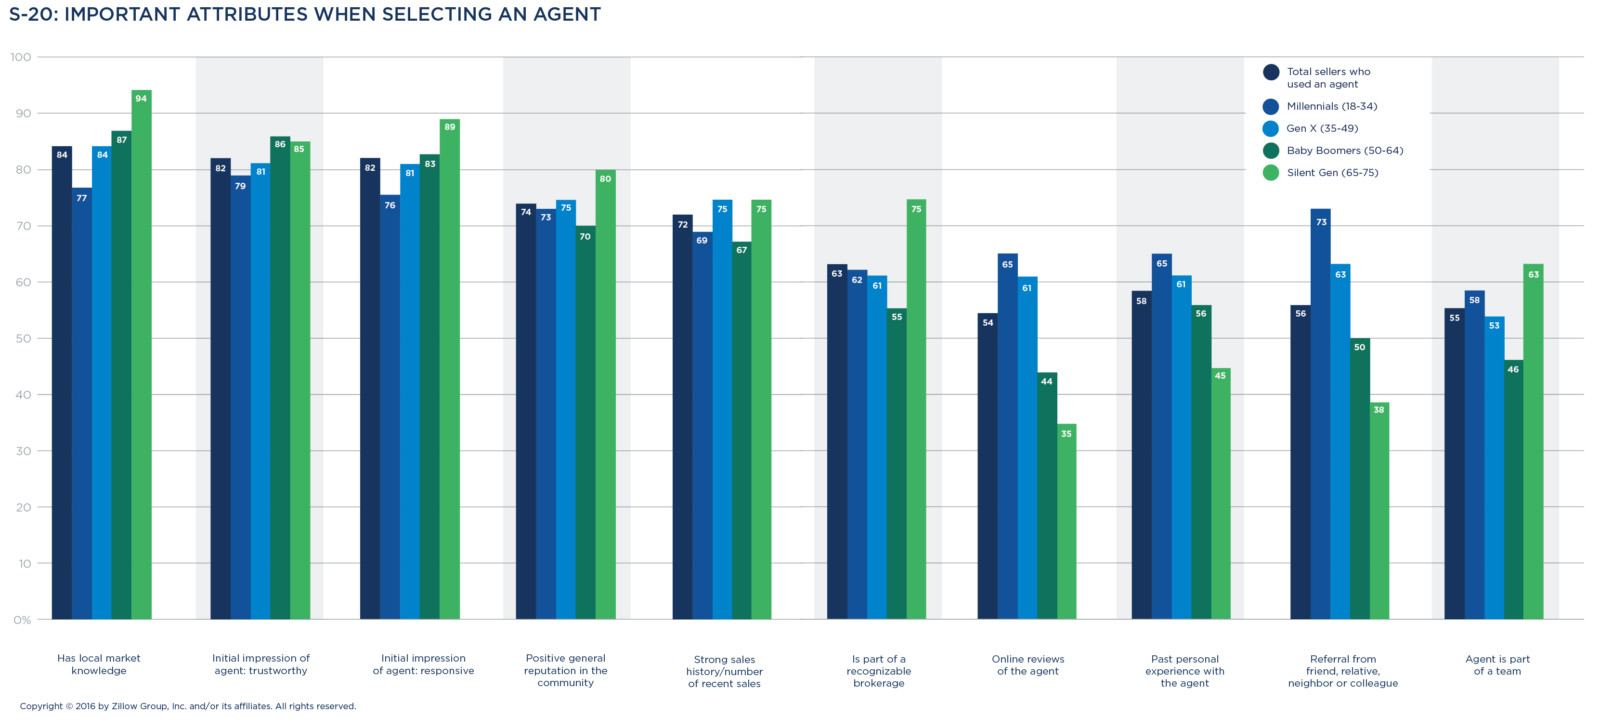
Among generations, Millennials place more emphasis on an agent’s online presence while those in the Silent Generation place more emphasis on an agent’s objective expertise and brokerage brand. Millennials skew higher in evaluating online reviews (65 percent), having an existing relationship with the agent (65 percent) and the agent being part of a team (58 percent). Silent Generation sellers, however, place more emphasis on local market knowledge (94 percent), responsiveness (89 percent) and affiliation with a well-known brokerage (75 percent).
Help with list price most valuable service
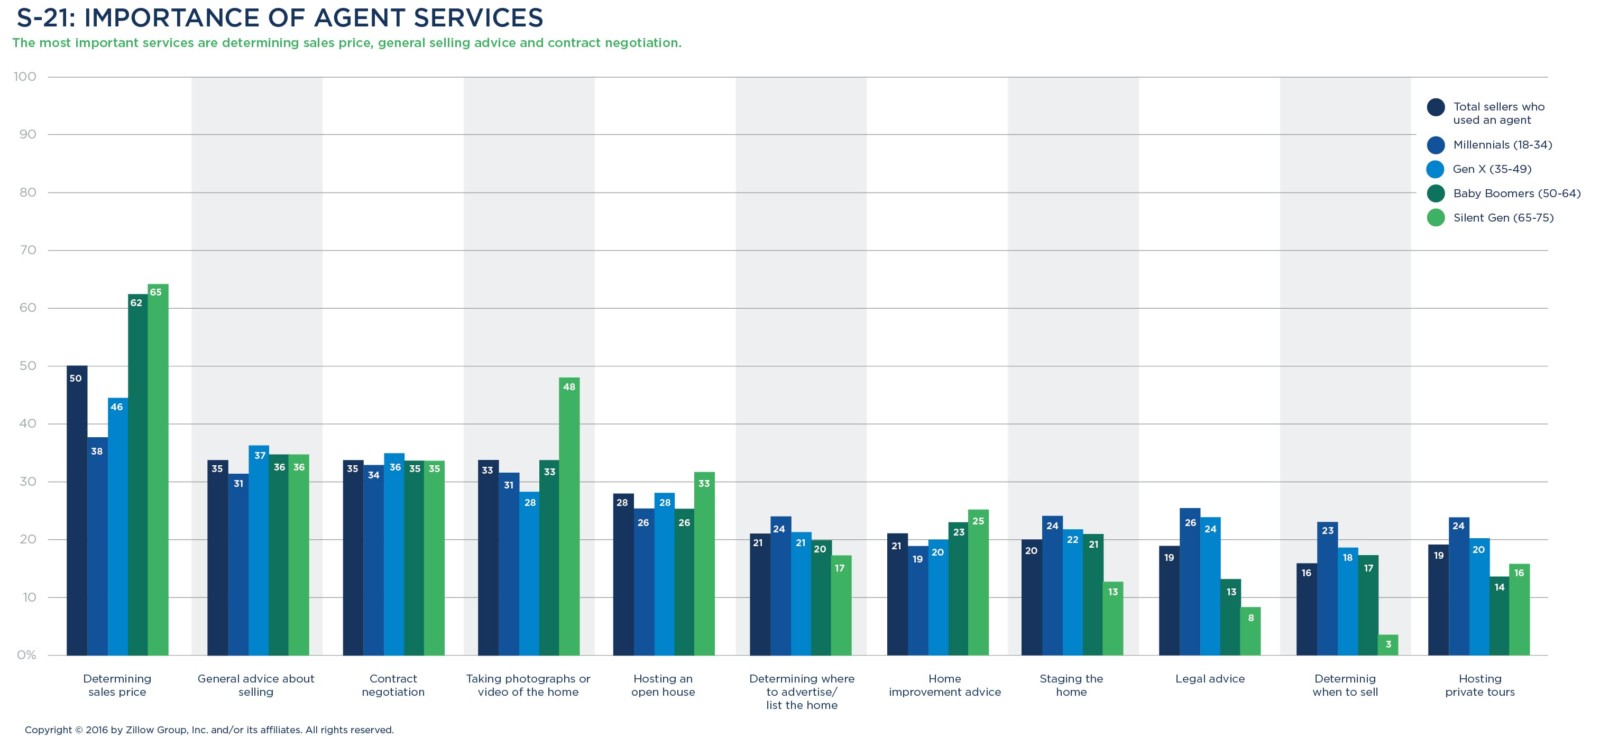
Sellers most often said they value agents’ help and expertise with respect to home price determination (50 percent) and sales contract negotiation (35 percent). They also turn to their agent for general advice about the sale process (35 percent).
Millennials are more likely to indicate legal advice (26 percent) and determining when to sell (23 percent) as being top services their agent provides. Among older sellers, more than six in 10 sellers look to their agent to price their home correctly (62 percent of Baby Boomers and 65 percent of the Silent Generation, compared to 46 percent of Generation X and 38 percent of Millennials). Silent Generation sellers are also interested in having their agent market their listing with graphically rich visuals including photos or videos (48 percent, versus approximately 30 percent for younger generations).
What agents are paid
When asked what percent commission agents were paid to sell their homes, most sellers reported that the listing agent’s commission fell within the 3 to 6 percent range (76 percent of sales). One in five paid a commission of 3 percent (22 percent), and only a minority of transactions paid an agent 2 percent or less in commission (10 percent).
Generation X sellers skew toward agents getting paid a 2 to 3 percent commission (36 percent), while Millennials are more likely to pay a commission in the 4 to 5 percent range (34 percent). Silent Generation sellers are most likely to pay a commission of 6 percent or more (42 percent).

Millennials most likely to negotiate
Agent commissions are occasionally a point of negotiation for sellers and buyers. Most sellers (67 percent) are willing to work on an agent’s terms and accept the commission rate from the get-go, while 33 percent try negotiating with their agent. Among those who attempt negotiation, just under half (48 percent) are successful in modifying some or all of the agent’s terms.
The older the seller, the less debate around commission. The Silent Generation (72 percent) and Baby Boomers (69 percent) are less likely than younger sellers to negotiate, while two out of every five Millennials (42 percent) negotiate. However, sellers ages 50 and over are more likely to be successful when they do negotiate, with 62 percent of Baby Boomers and 44 percent of the Silent Generation succeeding in changing agent terms, compared to 39 percent of Millennials.

FSBO SELLERS
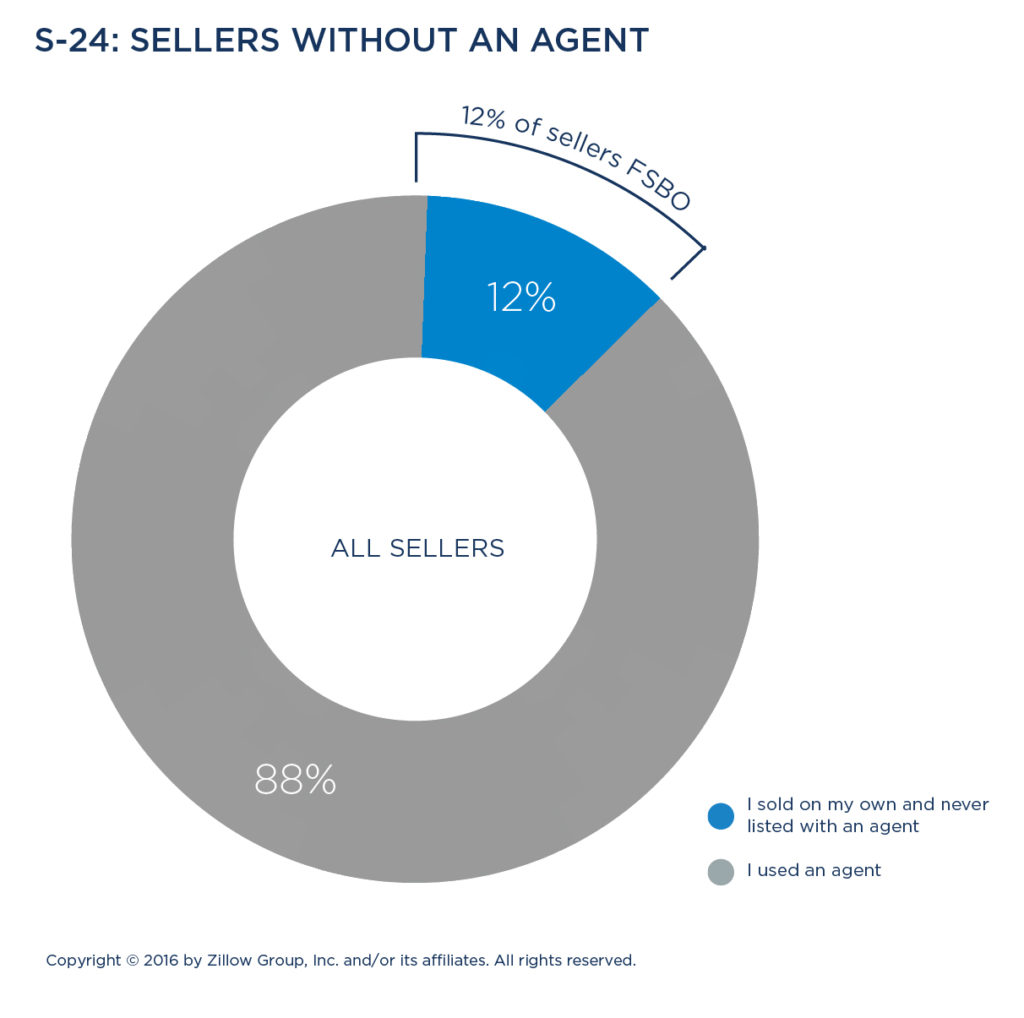 Going it alone
For Sale By Owner (FSBO) sellers who never used an agent comprise just 12 percent of the sellers market. When FSBO sellers opt out of working with an agent, their motives are typically saving money (61 percent)—presumably on agent commissions—or time (37 percent). Additionally, FSBO sellers are confident they can successfully sell on their own (36 percent), know prospective buyers (32 percent), feel they know their home’s attributes best (29 percent), or are opting to represent themselves because of a past negative agent experience (14 percent).

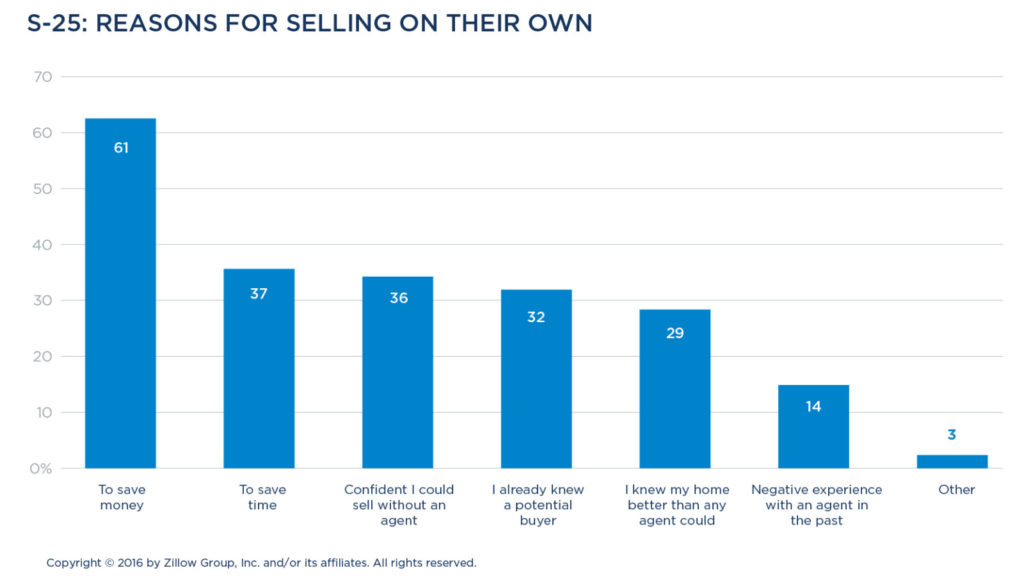
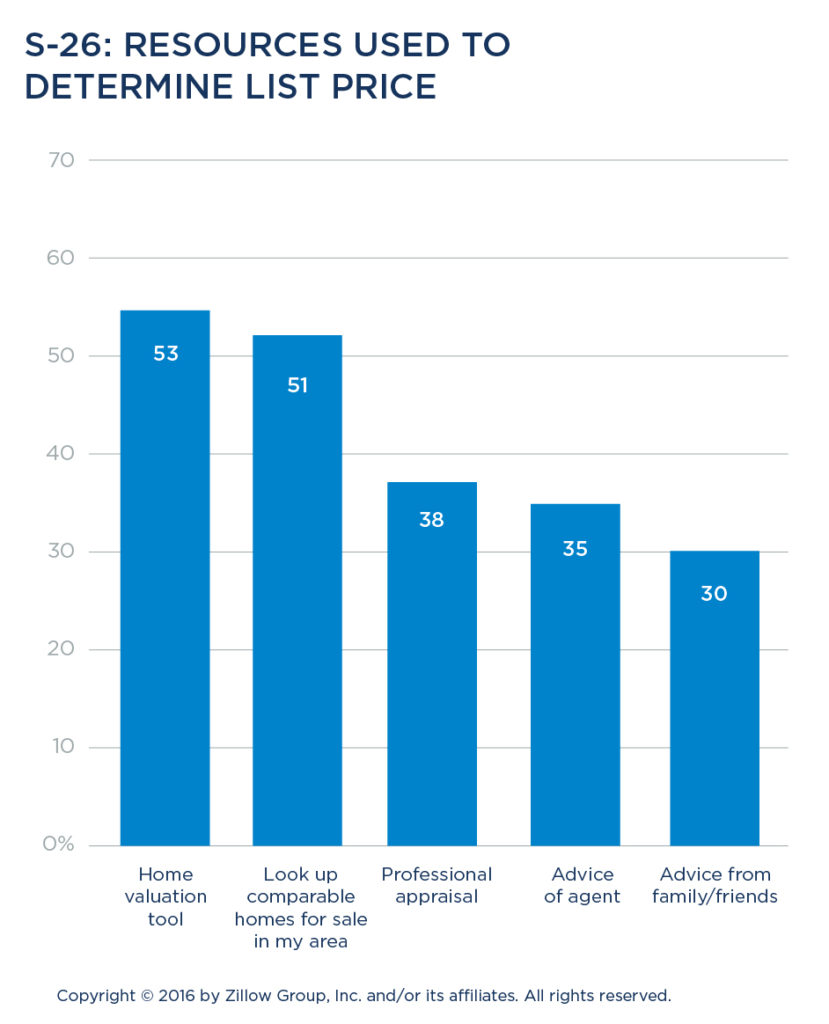
To determine their home’s list price, FSBO sellers turn to experts and online tools. These sellers may pay for a professional appraisal (38 percent), and about one in three take advice from a real estate agent (35 percent) or friends and family (30 percent). More than half (53 percent) of these sellers use online home valuation tools and many (51 percent) also turn to the internet to find comparable homes for sale in their communities.
When FSBO sellers pay to advertise their listing, most are using online resources to showcase their property. Top choices include a local multiple listing service site (47 percent) or online real estate sites (34 percent), with less use of print advertisements or direct mail (15 percent).
Families and Homeownership
Starting a family is a common catalyst to homeownership, and families are planning ahead to buy. Those with children at home get pre-approved more often than childless buyers (87 percent versus 76 percent) and set aside money over time for a down payment (59 percent versus 52 percent of those without children).
Families with kids have less flexibility than other buyers as they seek neighborhoods close to work and school and a single-family house. With housing costs rising much faster than most incomes, their financial struggles are clear as they juggle childcare costs, job opportunities and concerns about schools and safety.
Looking for a family home
Families with children at home are almost always searching for a single-family house (86 percent versus 81 percent for childless homes) and are stretching their budgets to buy bigger homes than others: They typically buy a median 2,000-square-foot house with three bedrooms, 2.5 bathrooms at a median price of $234,000—17 percent more than those without children in their home.
They most often buy in the suburbs (54 percent), versus an urban (25 percent) or rural (21 percent) area.
More than half of those with kids in the household (55 percent) consider brand-new homes, compared to 42 percent of childless buyers. Only 18 percent of families with kids would consider a townhouse, 10 percent a duplex or triplex, and 9 percent a condominium.
As a result, it may take families with children in the household more time to complete a home search compared to childless couples or singles—averaging 17.4 weeks, versus just 16.6 weeks for those without kids. Those with kids in the household tend to spend more time researching and analyzing their home purchase (58 percent) than acting on gut feeling (42 percent).
Budget considerations
More than a third (36 percent) of families with kids in the household say they went over their budget to buy. Only 28 percent of those without kids did.
Financial concerns were top-of-mind when choosing a mortgage: Getting the lowest rate was more likely to be very important to families with kids (82 percent) than those without kids (75 percent). Although 59 percent of those with kids in the households used their savings to make a down payment, those savings were often not enough. Thirty-eight percent of families with kids in the home said they used two or more sources for a down payment, compared to 26 percent of those with no kids.
Scraping together a down payment meant borrowing money and cashing in retirement funds: Families with kids were more likely than couples without kids to rely on family or friends for a loan (15 percent versus 7 percent for couples) or a gift (21 percent versus 11 percent for couples), or cash out retirement funds (16 percent versus 12 percent for couples).
Renovations and refinancing
Financial hurdles last beyond the home purchase. When renovating the home, those with kids in the household claimed their biggest home improvement challenge is being able to pay for what they really want to do (55 percent), followed by figuring out how much things really cost (44 percent).
When making home improvements, homeowners with kids are more likely to finance them with credit, using a cash-out refinance 7 percent of the time (the rate for couples without kids is 4 percent), 13 percent of the time with a home equity line of credit (compared to 10 percent of childless homeowners), and 30 percent with a credit card they can’t pay off right away (compared to 21 percent of owners without kids).
Refinancing is common for those with kids in the home—almost half (47 percent) have refinanced their original mortgage. For most of those with kids in the home, the goal for this refinance was to lower the interest rate (63 percent). For some (11 percent), a refinance is a way to help pay for their kids’ college educations.
Today’s Homeowner
As Millennials mature into midlife, the profile of who owns is diversifying rapidly. A higher proportion of younger buyers—and homeowners—are black/African-American, Latino/Hispanic or Asian/Pacific Islander than in older generations. Today’s homeowner likely lives in the suburbs, and is staying in their home for a long time—at least a decade.
Owners treat their home as a reflection of who they are rather than as an investment, but they’re also aware of the advantages of taking a DIY approach to repairs. Younger owners, especially, are ready to build sweat equity, while older generations age out of the urge to do things themselves.
While they see their home as a personal space rather than an investment, owners nonetheless manage their homes for maximum financial security. They refinance periodically to obtain the best mortgage rate and occasionally track their home’s value so they understand their equity position and local market.
HOMEOWNER CHARACTERISTICS & CONSIDERATIONS
Homeowners are married, educated and mid-career
Homeowners are defined as people who own their home and have lived there for more than a year.
Married, mid-career, educated, affluent, mostly Caucasian and living at the same suburban single-family home for over 10 years—that’s the settled-down American homeowner in a nutshell. The typical owner is Caucasian (77 percent), a Baby Boomer (35 percent) and has attended college (64 percent). Just under half (48 percent) of all owners live in households earning above $75,000.

Younger owners are more diverse
As newer buyers from the Millennial generation mature into their homeownership years, the profile of the typical American homeowner is shifting. Younger homeowners are more likely to be black/African-American, Latino/Hispanic, or Asian/Pacific Islander than older generations. Millennial owners are two-thirds (66 percent) Caucasian, whereas Generation X (72 percent), Baby Boomers (80 percent) and the Silent Generation (85 percent) skew more predominantly white.
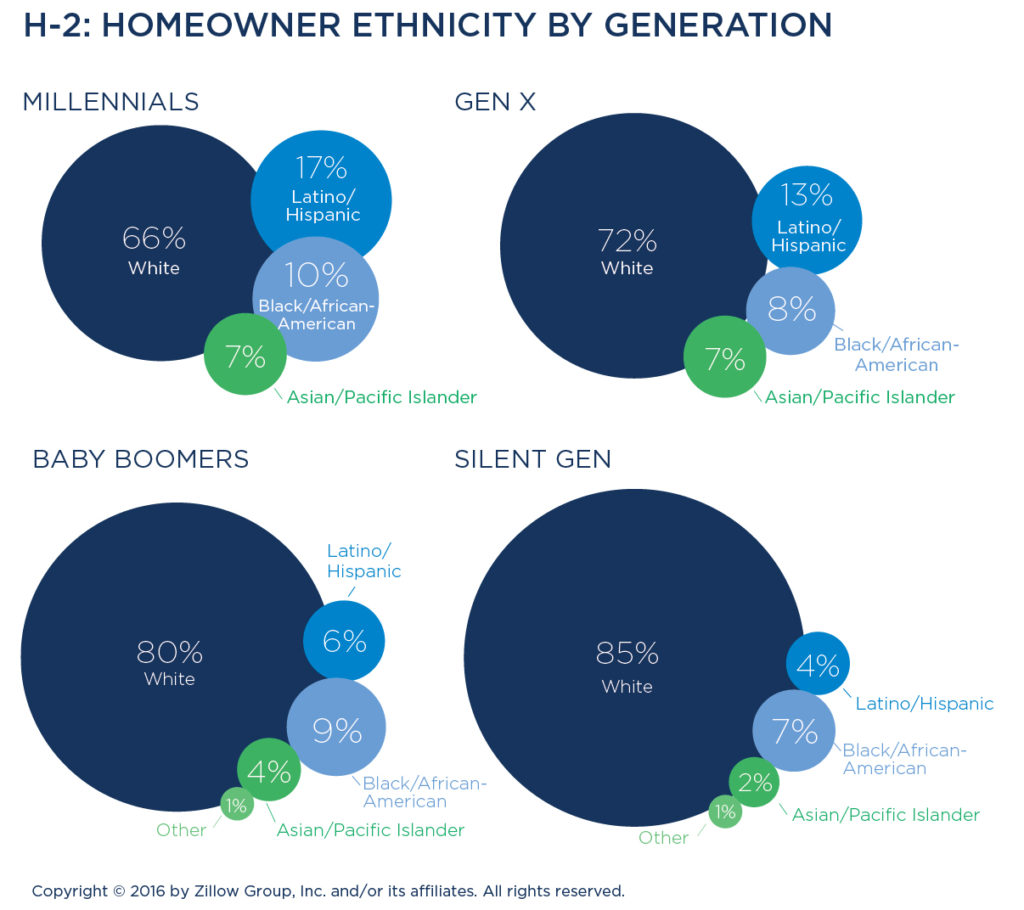
Differences by region
The Southeast (15 percent) has the highest share of homeowners earning less than $25,000, while the West and Northeast have some of the highest earners—37 percent of homeowners in these regions are earning six figures. First-time owners are more likely to be living in the Southeast (29 percent) and least likely to be living in the Southwest (9 percent). The Northeast has the highest share of townhouse ownership (8 percent), while the Midwest and Northeast boast the highest share of owners who have lived in their home for two or more decades (33 percent for both).

Many still reside in first home purchased
More than half (53 percent) of all homeowners are living in the first home they’ve purchased. The majority of those under age 50 (82 percent of Millennials, 65 percent of Generation X) currently reside in the first home they bought, while slightly less than half of Baby Boomers (45 percent) and over one in four (28 percent) Silent Generation owners still do.
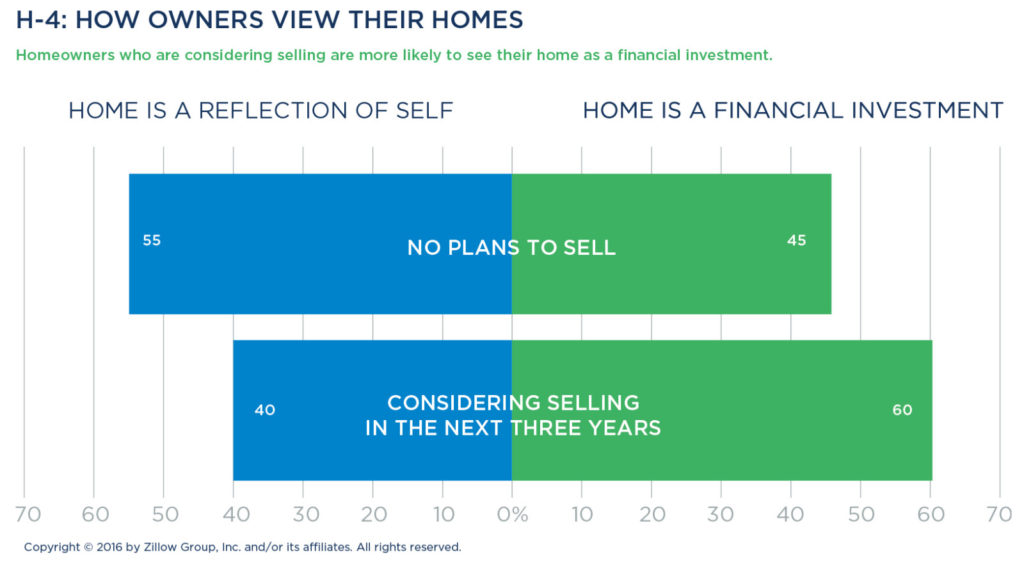
Homeowners are primarily couples
Homeowners typically share their home with a partner or spouse (73 percent) versus living with a roommate (2 percent) or solo (15 percent). More than one in three (35 percent) are raising children under 18 in the home, and more than four in 10 have pets (44 percent).
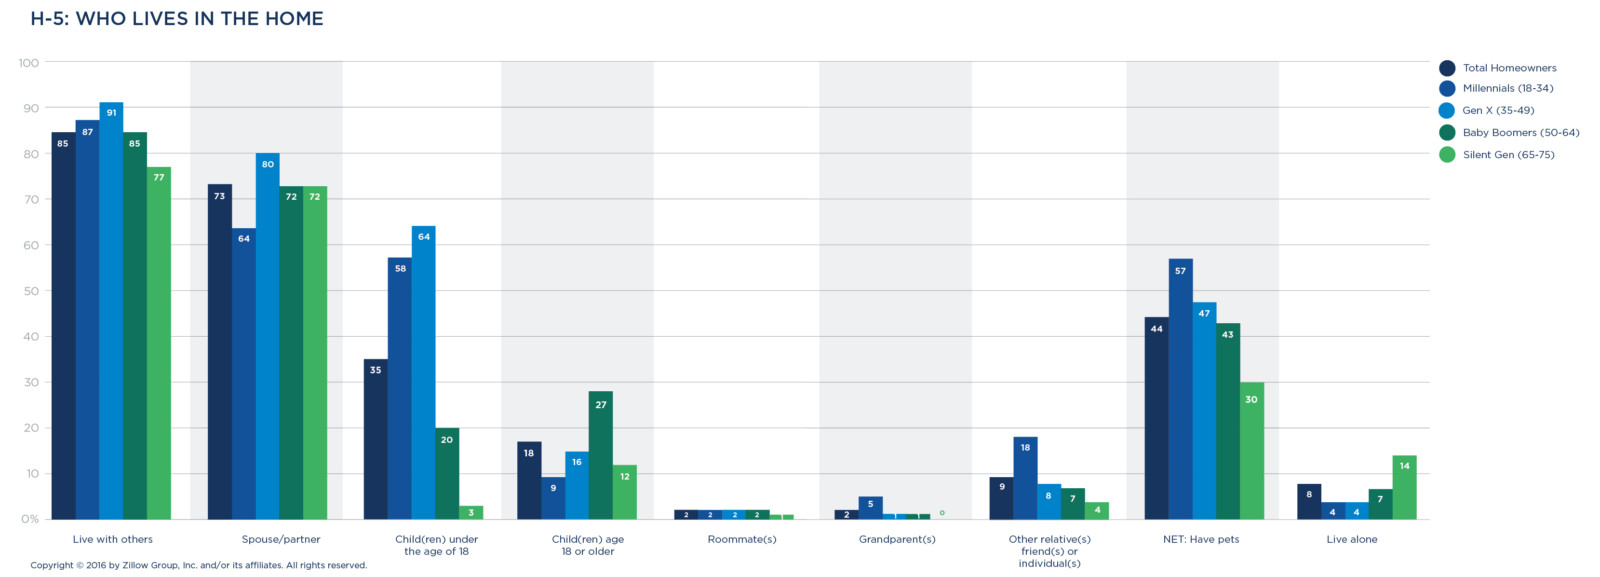
Millennial and Generation X homeowners are more likely to have children at home under the age of 18 (58 percent and 64 percent, respectively). Baby Boomers are the generation most likely to be sharing their home with adult children—one in four (27 percent) have children over the age of 18 at home.
Homeowners overall view their homes more as personal spaces (53 percent) than financial investments (47 percent). However, those considering selling in the next three years show the opposite psychology: six in 10 see their home as a financial investment, with the rest (40 percent) viewing their residence as a reflection of who they are.
Most live in the suburbs
Most homeowners live in the suburbs (52 percent) rather than an urban (23 percent) or rural (25 percent) setting. While owners opt for suburbia, they typically live outside (76 percent) rather than within (24 percent) a planned housing community with shared amenities.
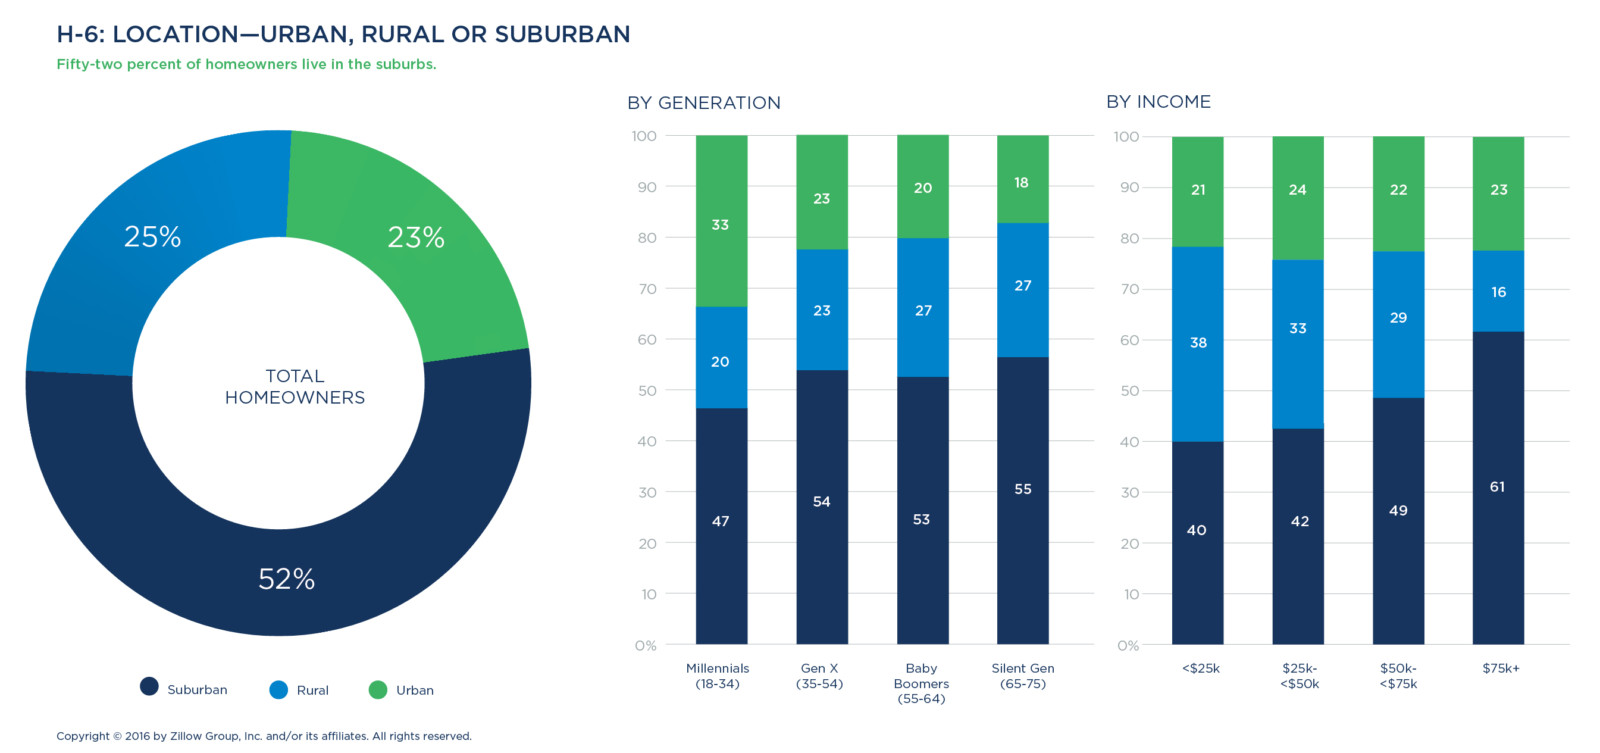
Household incomes influence where homeowners live:
- Urban environments are the most economically diverse when it comes to homeownership, with homeowners equally represented across a range of incomes.
- The lower a homeowner household’s income, the more likely the home is in a rural community: Over one in three owners with an income of less than $25,000 (38 percent) live in a rural area, compared to 16 percent of those making $75,000 or above.
- The higher the income, the more likely a homeowner is to reside in the suburbs: 61 percent of suburban homeowners make more than $75,000 a year.
Generationally speaking, the stereotype of Millennials as urban hipsters falls flat when it comes to homeownership. Nearly half of Millennial homeowners live in the suburbs (47 percent), while a third settle in an urban setting (33 percent); fewer opt for a rural area (20 percent). That said, Millennials are more likely than older generations to choose a community with shared amenities (30 percent).
While most Millennials opt for the suburbs, a larger proportion of them own homes in urban areas (33 percent) than Generation X (23 percent), Baby Boomers (20 percent) or members of the Silent Generation (18 percent). Baby Boomers and the Silent Generation (27 percent each) are the generations the most likely to live in rural areas.
Across regions, homeowners in the Southwest are more likely to live in a community featuring shared amenities (34 percent), while residents in the Midwest are among the least likely (16 percent) to seek such housing.
Western homeowners are more likely to live in urban environments (35 percent), while homeowners in the Northeast overwhelmingly live in the suburbs (57 percent) and homeowners in the Midwest (28 percent) and Southeast (30 percent) are more likely to live in rural areas compared to other regions.
Men are slightly more likely to own a home in an urban setting (26 percent versus women at 19 percent), while women are slightly more likely to own a home in a rural community (29 percent versus men at 20 percent). Both genders show an equal affection for the suburbs.
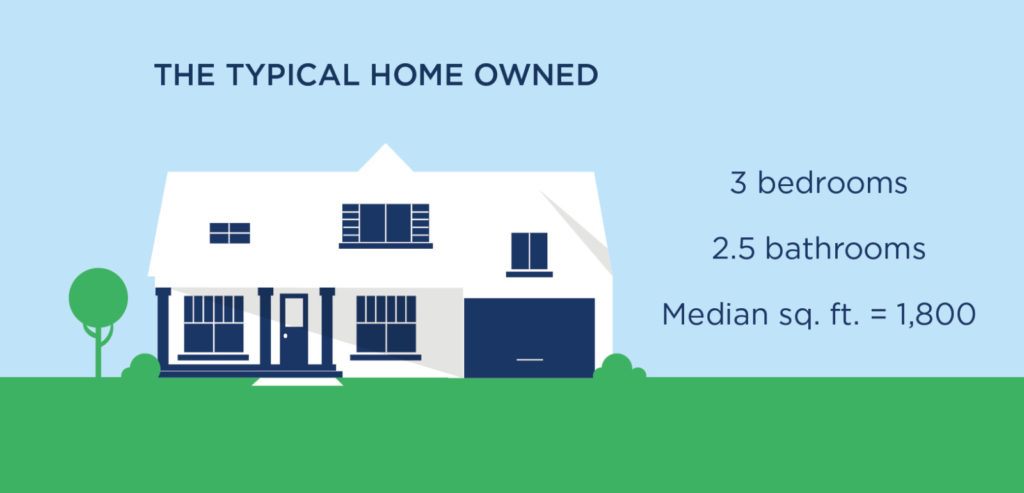 Single-family homes are predominant
The majority of homes owned in America are single-family homes (86 percent). Owned homes share a similar footprint to homes changing hands today—an approximately 2,000-square-foot single-family structure with three bedrooms and 2.5 bathrooms.
Millennials and members of the Silent Generation are more likely to own a two-bedroom home; Generation X and Boomers are more likely to have three or four bedrooms. Millennials are the most likely generation to own a home that is less than 750 square feet; 15 percent of them do.
Who’s living where?
- Single-family homes are the most common type of home owned in America, with more than 80 percent of each generation residing in them.
- Condo and co-op homes account for 4 percent of homes owned in the U.S. Single homeowners (12 percent) are three times more likely to own condos and co-ops than couples (4 percent) and four times more likely to own them than families (3 percent).
- Townhouses account for only 4 percent of all owned homes. Single owners (7 percent) own these homes more often than couples or families (4 percent), Millennials (6 percent) and Generation X (6 percent), Boomers (3 percent) or the Silent Generation (4 percent).
More than half built before 1980
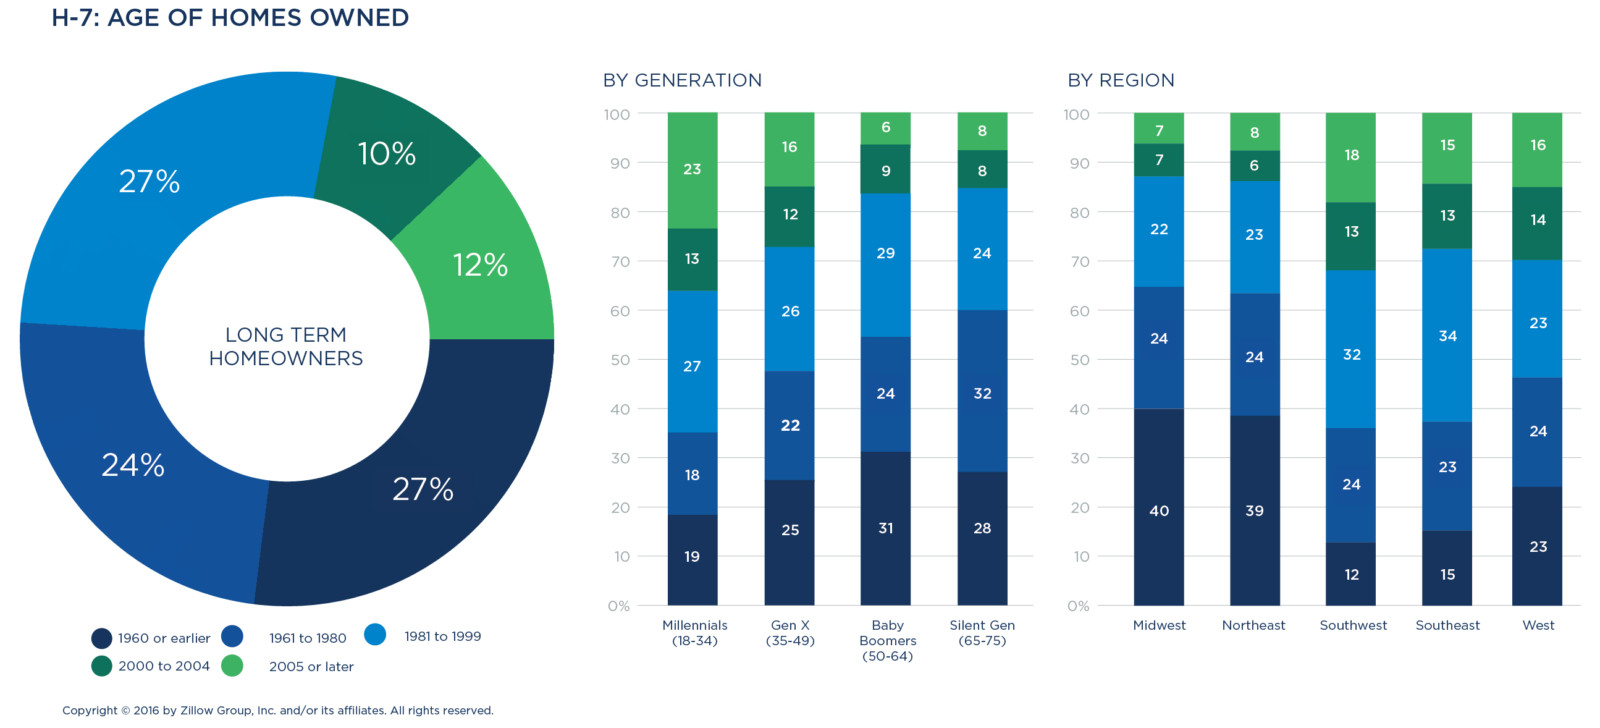
Half of all homes owned for one year or longer were built in 1980 or earlier, with just 12 percent of owned homes being built in 2005 or after. The older the homeowner, the more likely they live in an older home—with 31 percent of Baby Boomers living in homes built in 1960 or earlier. Millennial owners are the most likely to own homes built in 2005 or after (23 percent versus 16 percent for Generation X and 6 percent for Baby Boomers).
Midwesterners and Northeasterners own the most pre-1961 construction (40 percent and 39 percent, respectively), while owners in the Southwest and West show the highest ownership of post-2005 construction. Residents in the Southeast own the most 1980s and 1990s architecture (34 percent).
HOME IMPROVEMENTS & UPDATES

 Majority of owners make updates
Homeowners accept that improving their property comes with the territory. More than half of all homeowners purchased a property that needed updates, with most (45 percent) indicating the home needed some updating and a daring minority (7 percent) purchasing a home that needed a complete overhaul. Eighteen percent purchased a home that had been recently remodeled.
When it comes to ongoing home improvements, the average homeowner has made 6.7 improvements to their home. The most common improvements include painting the home’s interior, replacing appliances, getting new carpet or flooring, and landscaping the yard. Common large improvements, include a bathroom overhaul (30 percent), kitchen overhaul (22 percent), modifying their existing floor plan (16 percent) and finishing their basement (13 percent). Owners aged 65-75 are more likely to have completed a bathroom or kitchen overhaul (36 percent and 28 percent, respectively), whereas Millennials are slightly more likely to have finished their basement (16 percent).
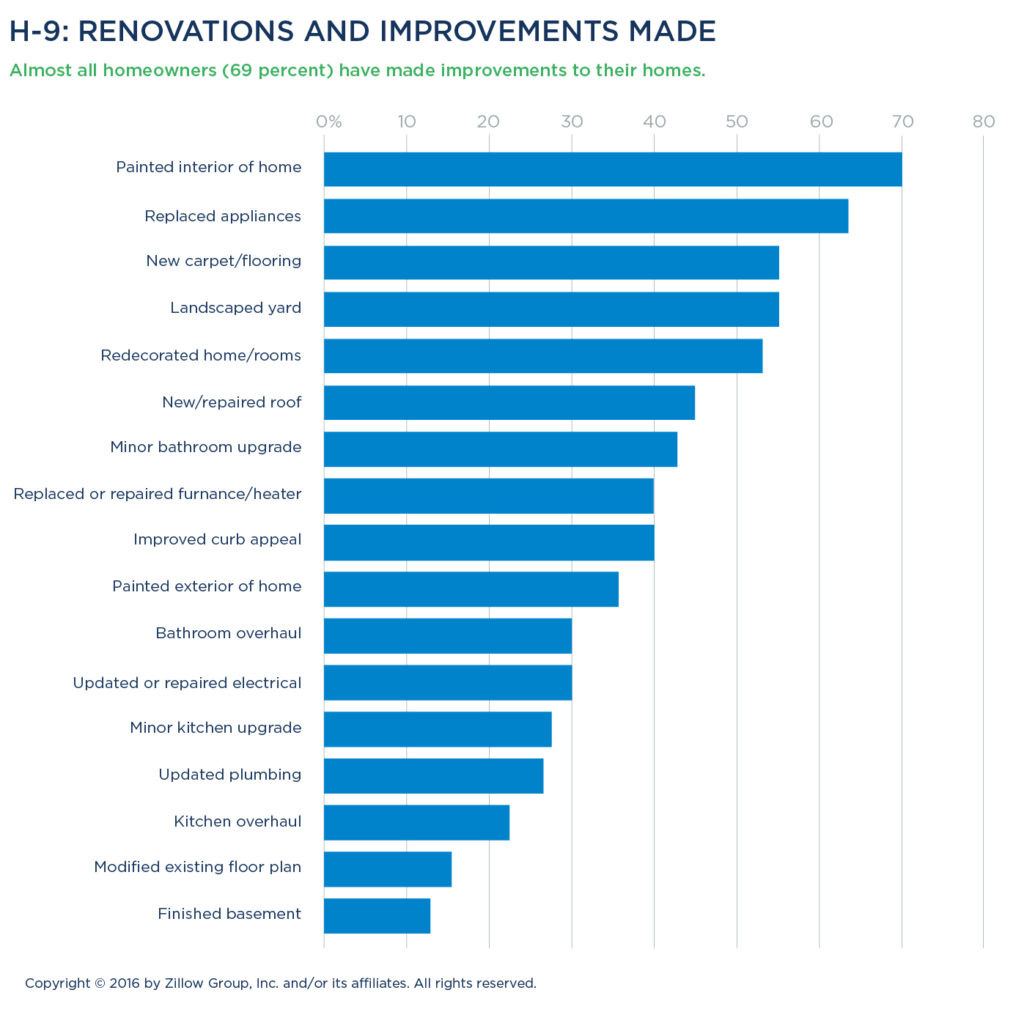
The majority (66 percent) choose to make improvements primarily to express their personal style, with fewer than one in 10 (9 percent) making improvements with an eye toward resale. Style improvements tend to involve interior and exterior painting, flooring replacement, minor kitchen and bathroom upgrades, and general redecorating. Among generations, Millennials show a higher interest (78 percent) in making upgrades to enhance their personal expression and to increase the home’s energy efficiency.
Improvements done primarily for the purpose of making an immediate repair include replacing appliances, getting a new or repaired roof, replacing or repairing their furnace, and updating plumbing. Larger projects tend to be completed primarily for the purpose of improving their functionality, including kitchen and bathroom overhauls, updating or repairing electrical or plumbing, modifying the existing floor plan and finishing the basement.
When it comes to renovating a home, men and women differ on the types of projects they’re most likely to tackle. Men show a higher preference for major and minor kitchen improvements and finishing basements. Women show a higher preference for interior redecorating, minor bathroom remodeling and replacing appliances.
Advice sought from multiple resources
Most homeowners (55 percent) rely on a contractor or professional when planning and making home improvements, but they also seek advice from family, friends and neighbors (52 percent) and conduct research via online resources (49 percent). Their local home improvement retailer is also a commonly used resource, with 70 percent using them in some fashion.

Real estate agents are rarely tapped for their home improvement expertise unless an owner is planning to sell. Only 9 percent of owners contact their agent for help, but if planning a sale, owners are more than twice as likely (22 percent) to reach out to their agent for advice or referrals.
Nearly one-third (32 percent) of Millennial owners use information from more than five resources. The majority of these young homeowners use online resources (71 percent), home improvement retailers (69 percent), information from friends and family (64 percent) and videos (61 percent). Generation X and Baby Boomer owners most often turn to home improvement retailers (73 and 72 percent, respectively) as a source of information.
Members of the Silent Generation most frequently tap a contractor or professional (61 percent) or a home improvement retailer (65 percent), relying less often than other generations on doing their own online research (25 percent) or using mobile resources (5 percent).
Majority willing to DIY
Most homeowners eventually confront this dilemma: Should they hire a professional contractor or attempt a home improvement project themselves? The majority of homeowners (62 percent) say they prefer to tackle home-related projects themselves versus work with contractors (38 percent). The younger the owner, the more willing they are to DIY a project. More than two-thirds of Millennials (69 percent) say they plan to do their own repairs, whereas just over half (52 percent) of the Silent Generation are willing.
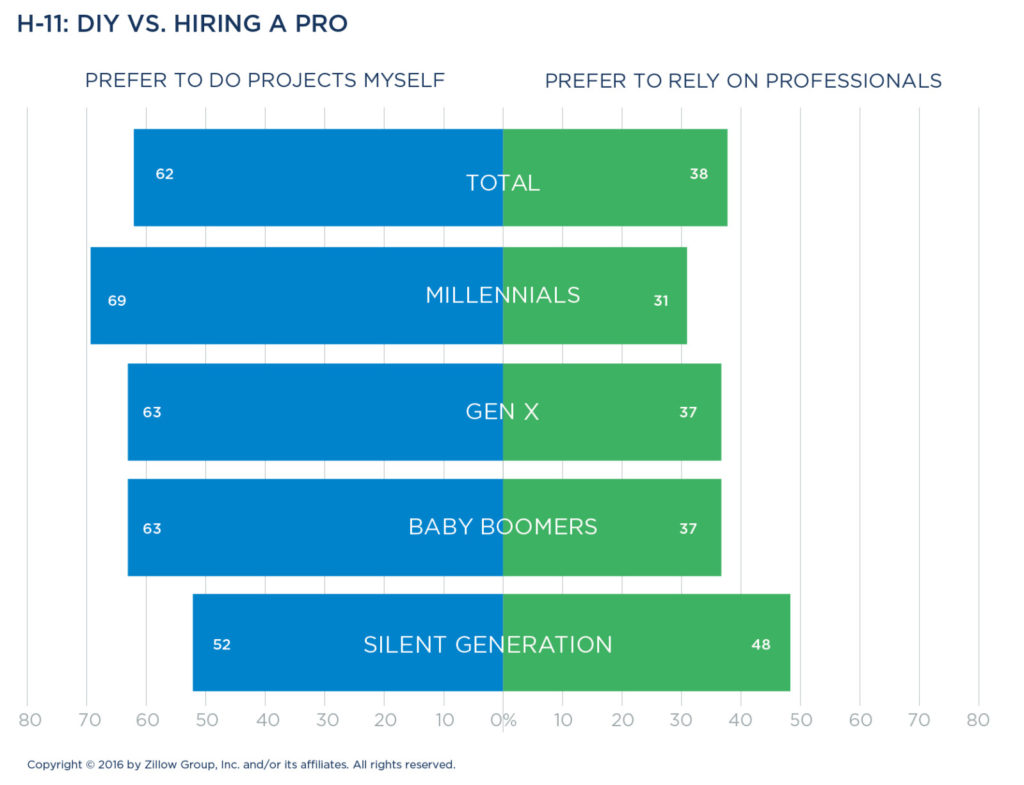
A preference for DIY is higher among families and couples (versus singles), those with households earning below $75,000, and those living in a rural location.
The projects where a professional is most likely to be hired include replacing or repairing the roof, repairing or replacing the furnace, updating or repairing electrical, installing new carpeting or flooring, updating plumbing, completing a bathroom or kitchen overhaul, and modifying an existing floor plan. Less labor- and skill-intensive projects are more likely to be completed by the owner, including interior painting and redecorating, replacing appliances, landscaping and improving curb appeal, and completing a minor bathroom upgrade.
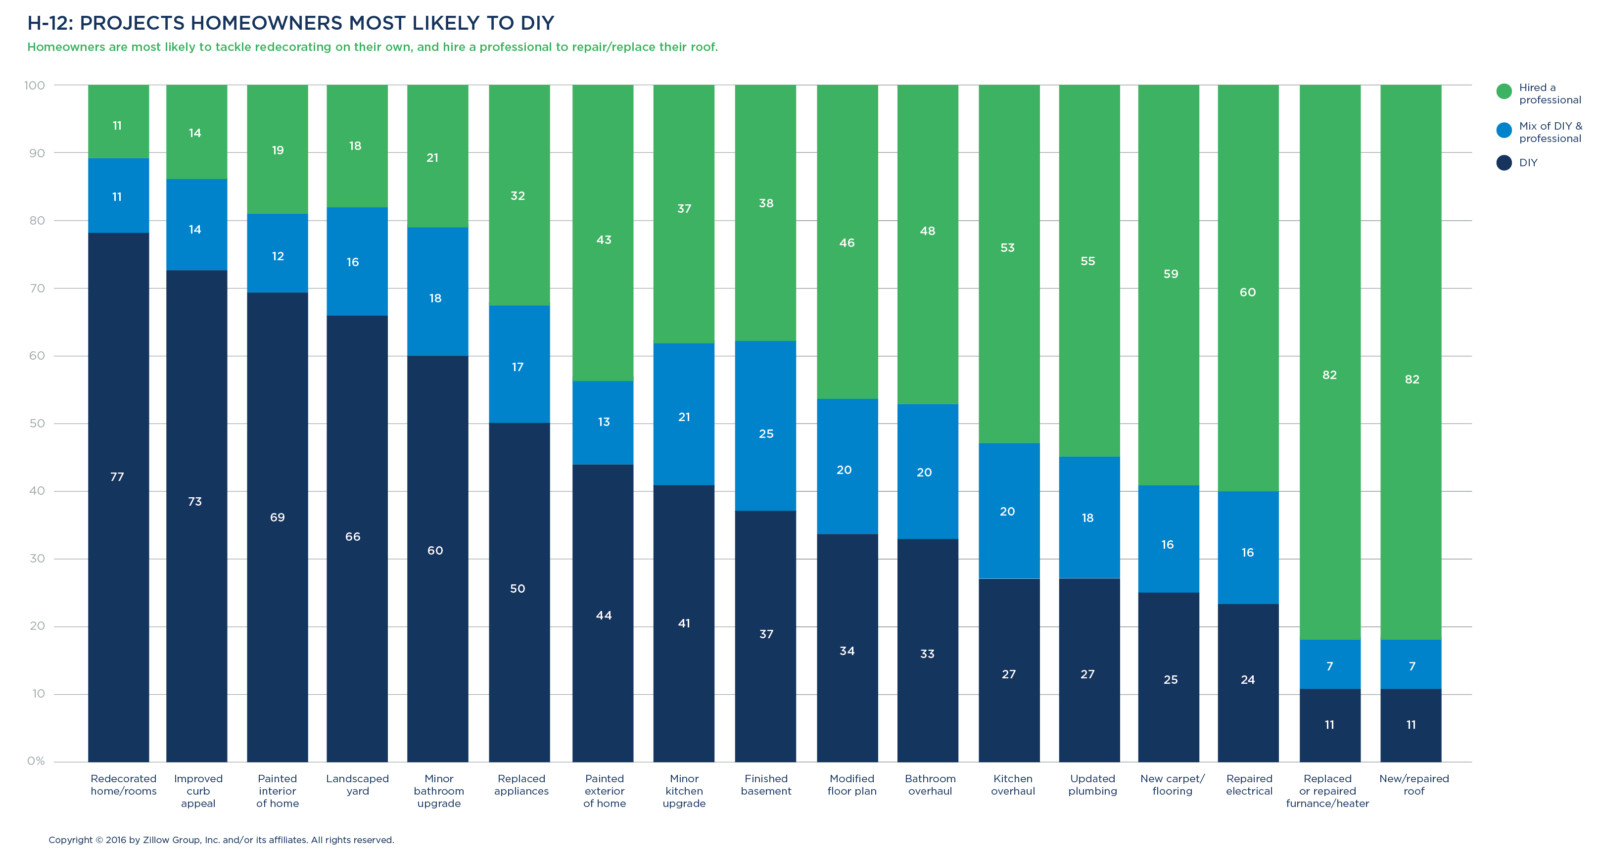
Millennials show a willingness to use a mix of do-it-yourself approaches and professional help. These young homeowners are among the most willing to use a combined approach for projects like minor kitchen remodeling (26 percent), or to complete all the work in that improvement category themselves (49 percent).
Generation X owners will do light work such as interior decorating (79 percent) but they tend to hire professionals for large-footprint projects such as kitchen overhauls (49 percent) and basement build-outs (47 percent).
Baby Boomers are willing to tackle light DIY projects outdoors, such as landscaping (69 percent) and curb appeal improvements (75 percent). Indoors, they’re willing to replace appliances (52 percent) or manage bathroom upgrade projects (63 percent).
Members of the Silent Generation are more inclined to hire professionals and contractors when projects need to be done around the home. Nearly half (48 percent) prefer to hire professional help, versus the overall average (38 percent).
Most projects stay within budget
Most owners reported keeping their projects within budget, both for DIY approaches and when using a professional. Seventy-nine percent of projects completed DIY were either on budget or cheaper than anticipated, compared to 61 percent of projects where a professional completed the work. Millennial owners are the most likely generation to exceed their budget, particularly for projects where they hired a professional: Half of these projects went over budget, compared to 38 percent of projects undertaken by those age 35 or older. In contrast, more than six in 10 homeowners age 50 and older indicated that their projects ended up costing about what they budgeted, regardless of being completed DIY or by a professional.
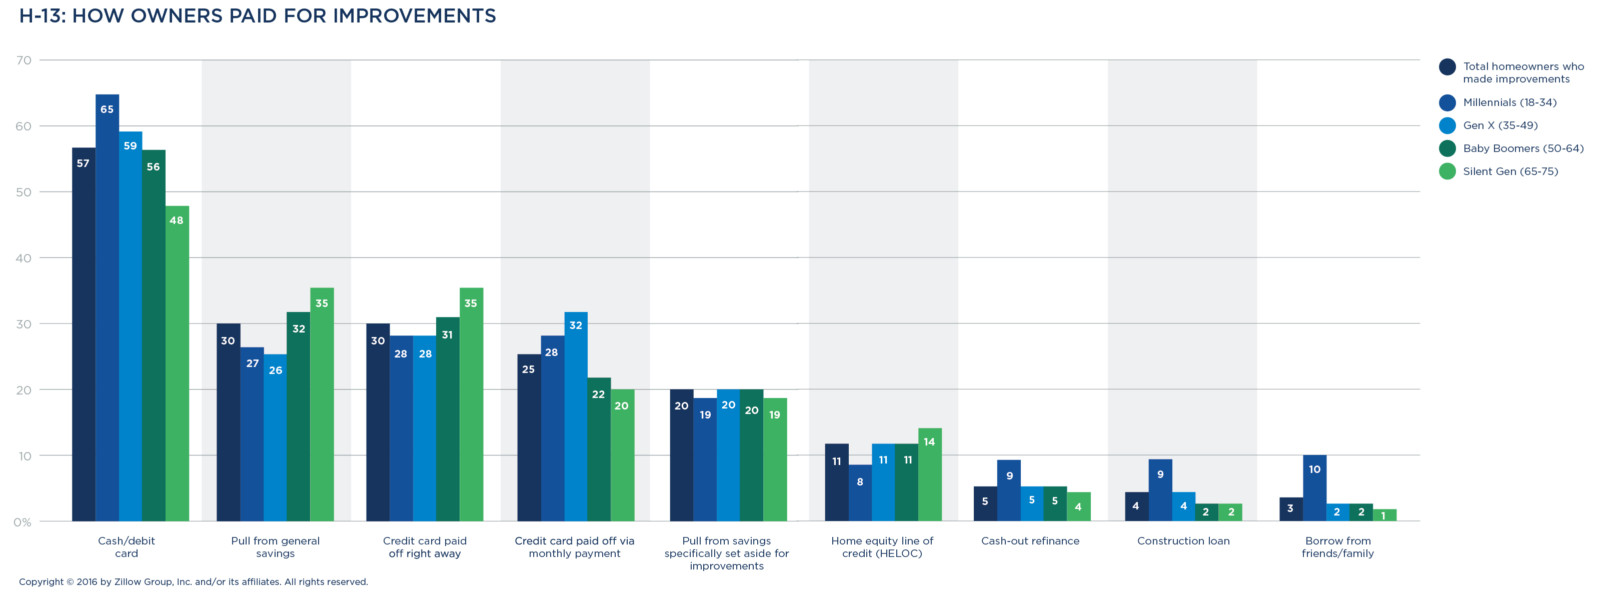
When paying for home improvements, more than half (57 percent) of all homeowners use cash or a debit card, followed by general savings (30 percent). Paying with a regularly paid-off credit card appeals particularly to owners in Western states (37 percent). Paying off over time, via monthly payments, appeals most to families (30 percent), while using a home equity line of credit (HELOC) is more common among those in the Northeast (16 percent). Just 20 percent of owners pull from savings that are specifically set aside for improvements.
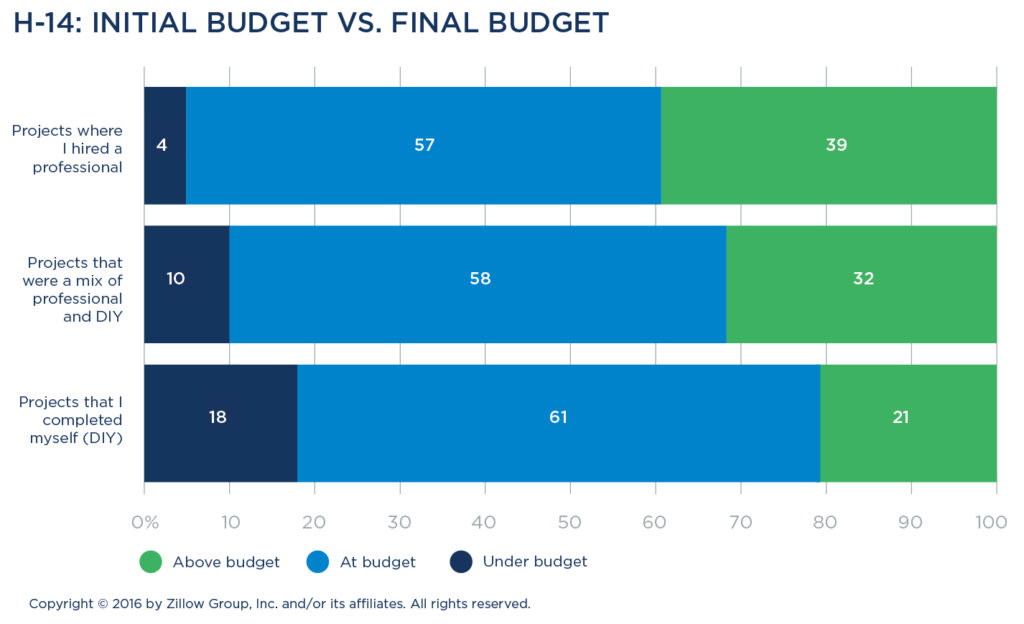
Majority of projects meet expectations
The overwhelming majority of home improvement projects met or exceeded initial expectations: More than half (52 to 58 percent) of professional and DIY projects turned out how owners expected, with an additional 38 to 43 percent indicating the project turned out better than expected. Less than 5 percent of projects turned out worse than anticipated.
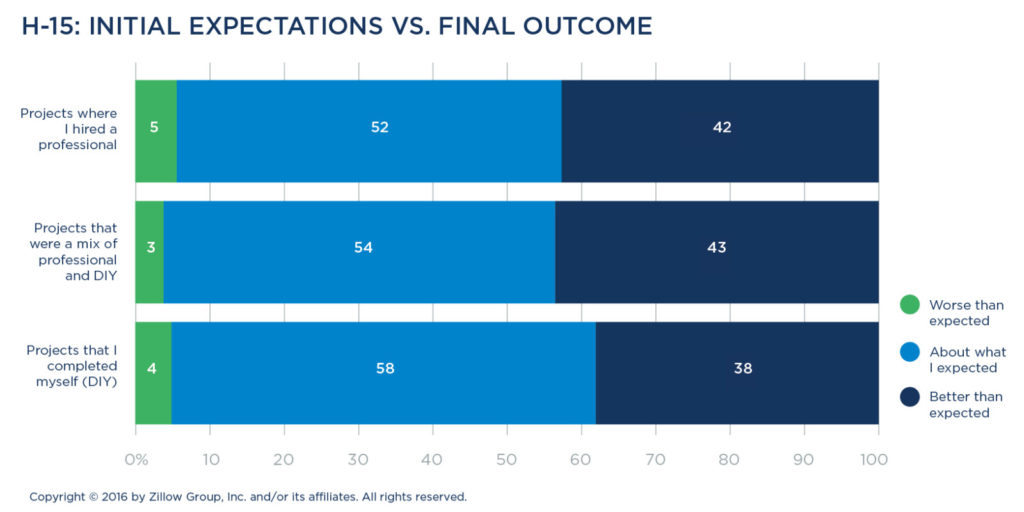
Ongoing maintenance
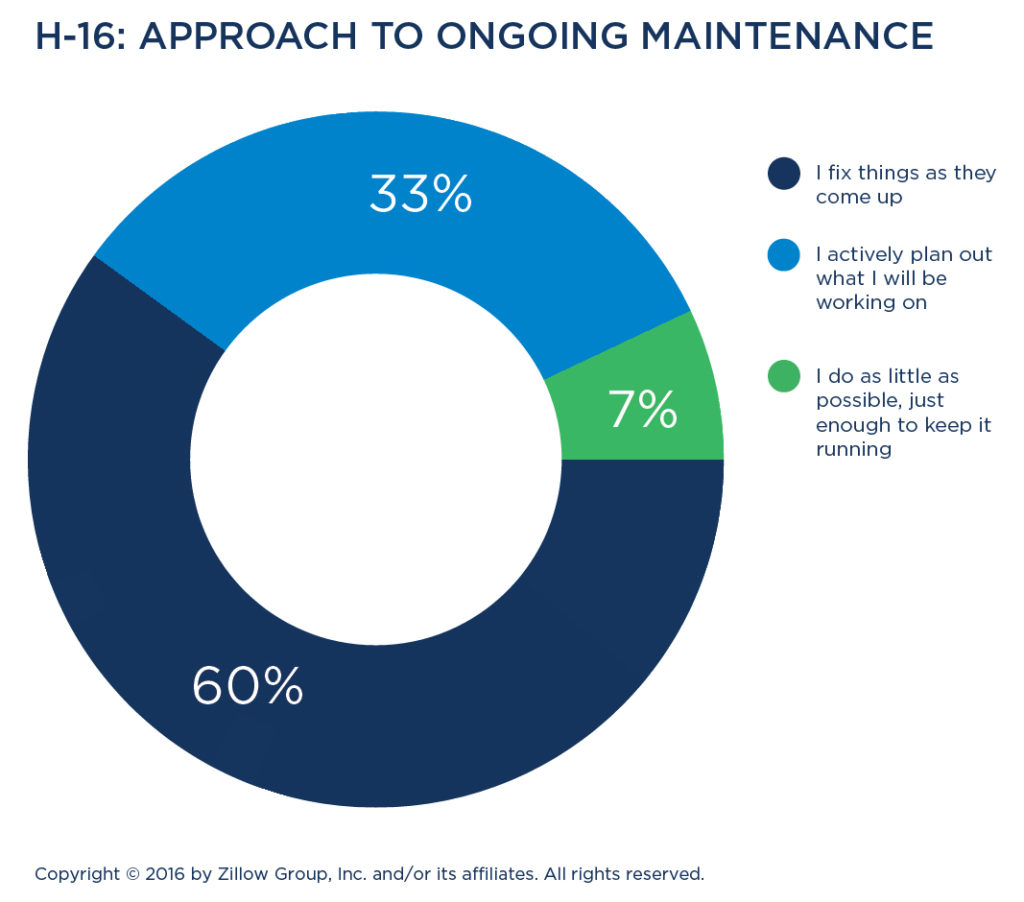 When it comes to ongoing maintenance, most homeowners (60 percent) deal with issues on an as-needed basis, taking an “if it ain’t broke, don’t fix it” approach. However, one in three (33 percent) owners takes a more organized stance toward home maintenance with a plan that prioritizes repairs or assumes periodic attention to home systems.
  Millennials are more likely than older age cohorts to take a more proactive approach to home maintenance, with four in 10 (41 percent) indicating they actively plan out what they’ll be working on. Fewer than one in 10 homeowners (7 percent) report doing the bare minimum to keep their homes running.
The most common maintenance-related projects where owners involve a professional include air conditioning maintenance, furnace/HVAC maintenance, pest control, chimney cleaning, and pest control. Climate plays a major role when it comes to home maintenance, as the Silent Generation and residents of the Southwest are particularly worried about air conditioning, while residents of the Midwest and Northeast seek help for furnace upkeep.

Homeowners report that their maintenance challenges involve:
- Financing projects (53 percent)
- Calculating costs for repairs or parts (43 percent)
- Deciding what to fix or improve next (41 percent)
Among generations, Millennials struggle to find the time to handle the work, while Baby Boomers and the Silent Generation worry about systems breaking and being able to afford the necessary ongoing maintenance. Families struggle with financing projects, while single owners are concerned about how to anticipate when various systems will need attention.

Snapshot: The Drive to DIY
Almost all of U.S. homeowners (96 percent) have made some improvement to their homes, from painting and redecorating to a full kitchen overhaul. Often, they hire professionals, but across all demographics, many owners are taking on projects themselves.
The most exuberant DIYers are Midwesterners, Millennials, women, and couples who more often tackle large projects. What unites DIYers is their motivation to bring personal style to their home rather than making renovations purely for the sake of boosting home value.
Here’s a look at how differing populations approach DIY.
Midwesterners
Homeowners in the Midwest are most likely to classify themselves as home improvers. When they turn to home improvement projects, they show the highest preference (65 percent) among residents of any region for approaching projects themselves.
Nothing is too difficult: When Midwestern homeowners take on a DIY project they tackle complex or labor-intensive projects like bathroom overhauls (42 percent) or basement remodels (44 percent). More than half (54 percent) are willing to take on a minor kitchen upgrade, whereas fewer than four in 10 owners elsewhere tackle fixing this heart of the home.
Millennials
Millennials are the “handyman” generation, and are quick to DIY major projects rather than pay laborers. In all, 69 percent of Millennials indicate that when projects need to be done around the home, they prefer to do them directly as opposed to relying on professionals. Among the generations, they show the highest willingness to tackle appliance installation (65 percent), the installation of new carpet or flooring (34 percent) or update plumbing (33 percent). Two in 10 (21 percent) would replace or repair a roof, versus about one in 10 for Baby Boomer or Silent Generation homeowners (11 percent and 7 percent, respectively).
Millennials are young and ambitious, which may fuel their confidence about taking matters into their own hands. Despite their inexperience, three out of four Millennials (74 percent) report that they came in at or below their DIY project budget, which is about on par with other generations. Additionally, a larger share of Millennials live in urban areas (33 percent), where DIY may be the more affordable option.
Women
Along gender lines, women are much more willing than men to tackle redecorating or aesthetic changes. More women than men tackle redecorating (82 percent versus 72 percent) and go in for DIY landscaping projects (69 percent versus 62 percent). Indoors, they will happily paint (71 percent) or update appliances (51 percent). Women are more likely than men to improve curb appeal (74 percent versus 71 percent) on their own, too.
Nesters
DIY projects are more common among couples than in single households, suggesting that collaborating on home projects is most enjoyed when there’s more than one set of helping hands.
Four in five (78 percent) of all childless couples DIY their decorating efforts, more than three in five (65 percent) handle their own landscaping, and nearly half (47 percent) DIY appliance updates.
Families with kids are more likely those without kids to paint the interior of their home (52 percent versus 48 percent) and nearly as likely as their childless counterparts to handle appliance (35 percent) and bathroom updates (34 percent).
REFINANCING & LENDER DECISIONS
Most still paying off mortgage

Nearly six in 10 homeowners (58 percent) have a mortgage loan they are in the process of paying. The Silent Generation is the age group least likely to still be making payments, as more than half (53 percent) own their home free and clear.
Regionally, residents in the Northeast (40 percent) are the most likely to have paid off their mortgage. Among households, single owners (45 percent) are more likely to have paid down the mortgage than families (29 percent).
Just under half have refinanced
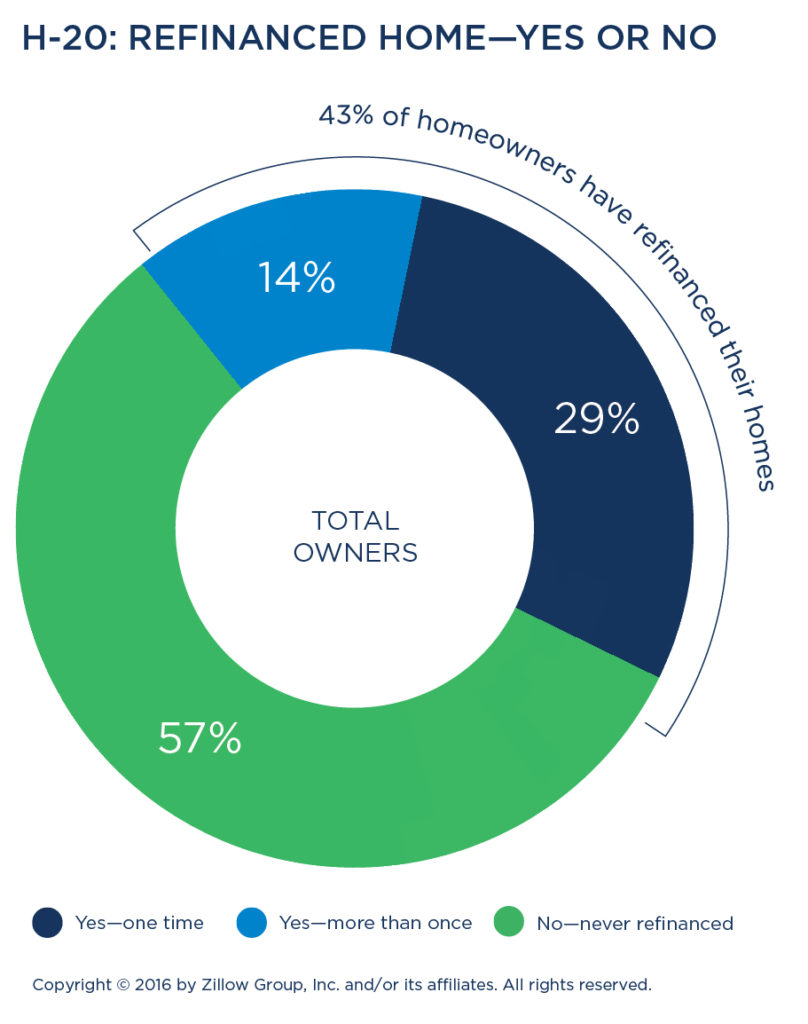 Many homeowners refinance their home to take advantage of shifts in current interest rates or to use a combination of rates and additional cash down payment to create a lower monthly payment. Four out of 10 homeowners (43 percent) have refinanced their home at least once, with those planning to sell or currently selling (57 percent) and residents in the West (53 percent) among the most likely. Additionally, owners of single-family homes (45 percent) and Baby Boomers (48 percent) show a higher predilection toward refinancing than their respective counterparts.
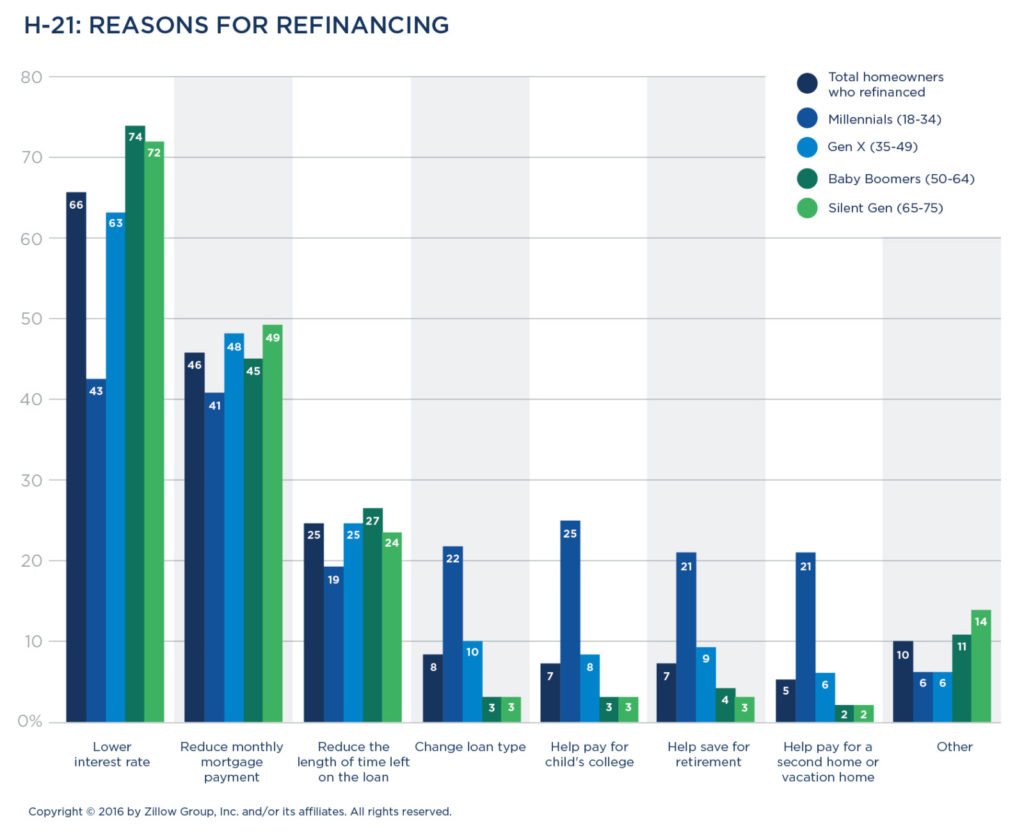
A small group of homeowners have chosen to refinance more than once over their lifetime (14 percent). Nearly one in five of those 50 and older (18 percent of Silent Generation, 17 percent of Baby Boomers) have refinanced more than once.
More than half of all homeowners who have refinanced (63 percent) have done so in the past five years, and three out of four (75 percent) prospective sellers have refinanced within the past five years. Silent Generation and Baby Boomers are most likely to have refinanced six or more years ago, while the Millennial demographic are most likely (14 percent) to have refinanced within the past year.

When refinancing, two out of three (66 percent) homeowners say they are seeking lower interest rates on their mortgage loan and nearly half (46 percent) are hoping a refinance will lead to lower mortgage payments. A small group refinanced to change their loan type (8 percent), driven predominantly by Millennials (22 percent).
Selecting a lender

Nearly half (46 percent) of all owners who refinanced used their current financial institution and just over one in 10 (13 percent) turned to referrals from friends to find a lender. Thirteen percent of Millennials found their lender through an online search engine, and 11 percent found a lender through a real estate-related website.
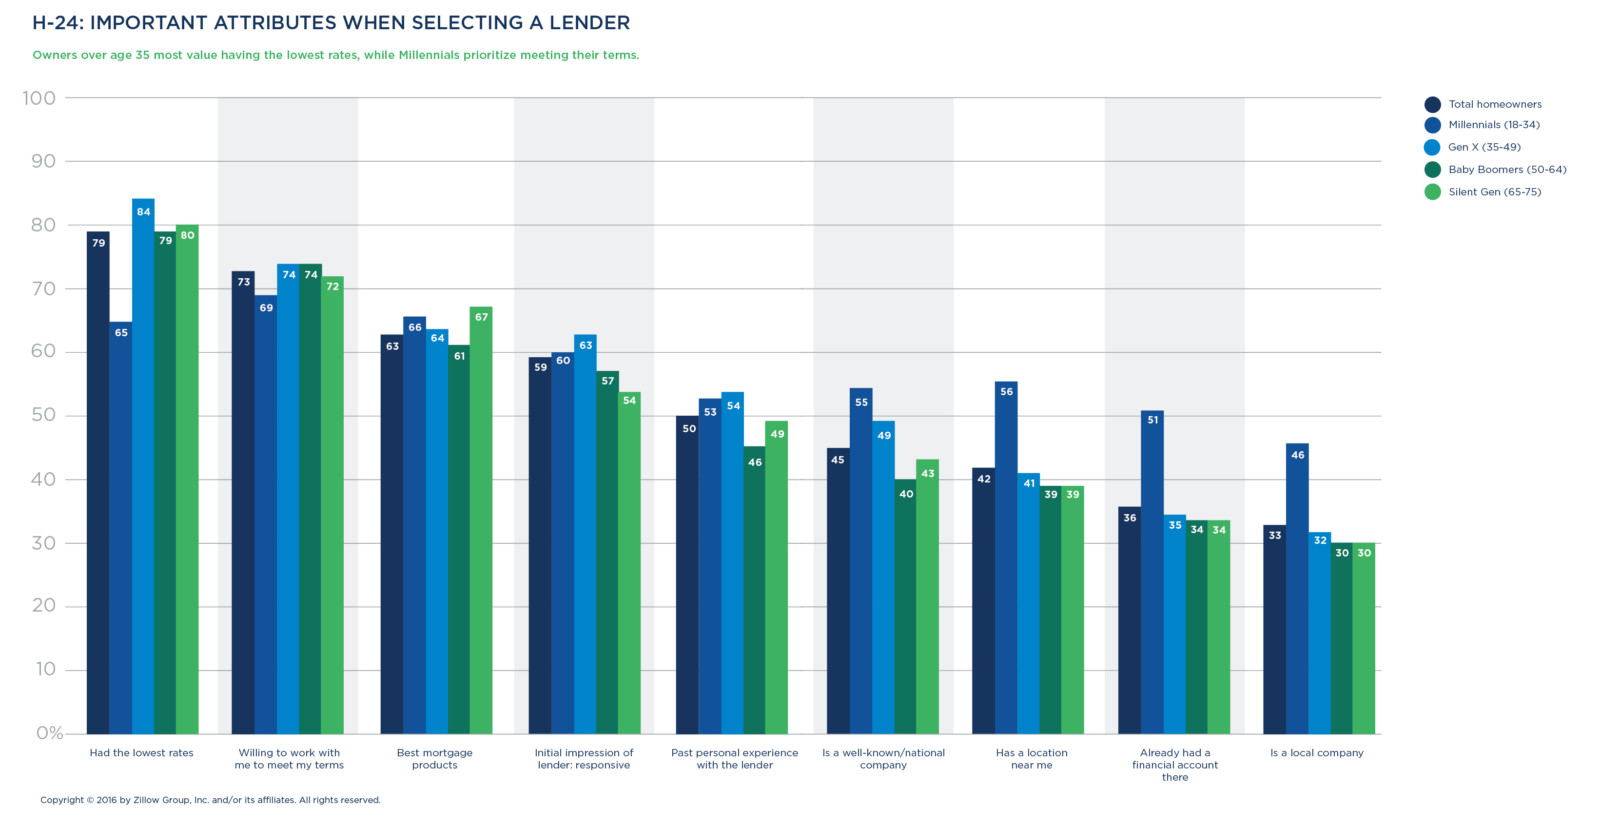
When evaluating mortgage providers for refinancing, the most important factors for homeowners are having the lowest rates and being willing to meet their terms. Past personal experience with the lender is also critical, with 50 percent of homeowners who refinanced indicating this is important.
Millennials are less focused on having the lowest rates—65 percent indicate this is important, compared to 84 percent for Generation X, 79 percent for Baby Boomers and 80 percent for the Silent Generation. Instead, Millennials place more emphasis on having the best mortgage products (66 percent). They also indicate that having a location near them (56 percent), already having an account with that lender (51 percent), and being a local company (46 percent) as more important attributes compared to those older than 35.
Renting the home
Most homeowners (93 percent) do not rent any portion of their primary home. A small minority now rent to others (3 percent) or intend to within three years (4 percent), and among U.S. regions, residents in the pricey West show more openness to doing so (9 percent).
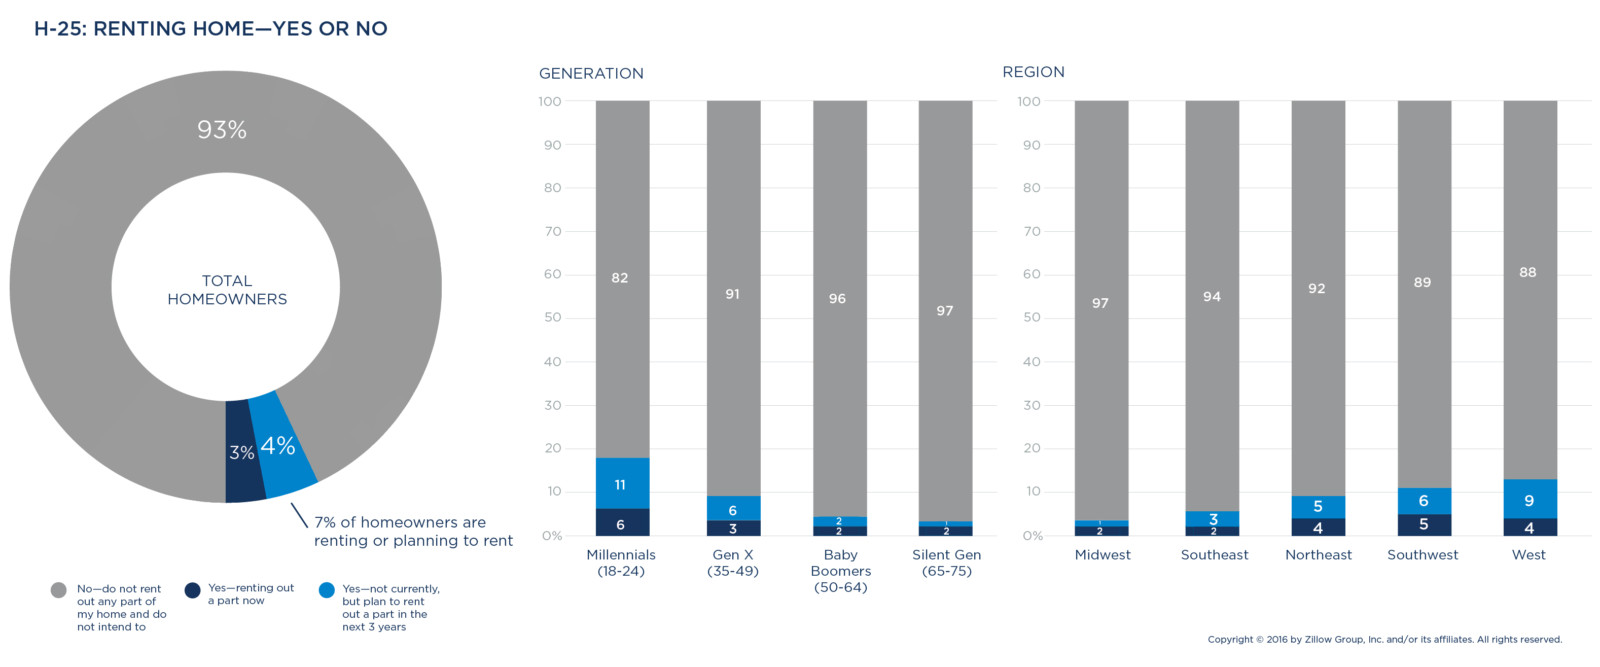
Generationally, Millennials are the most likely to rent out their primary home for income (6 percent) or have plans to do so (11 percent), while older owners have less interest in using their primary home for rental income.
Owning additional homes
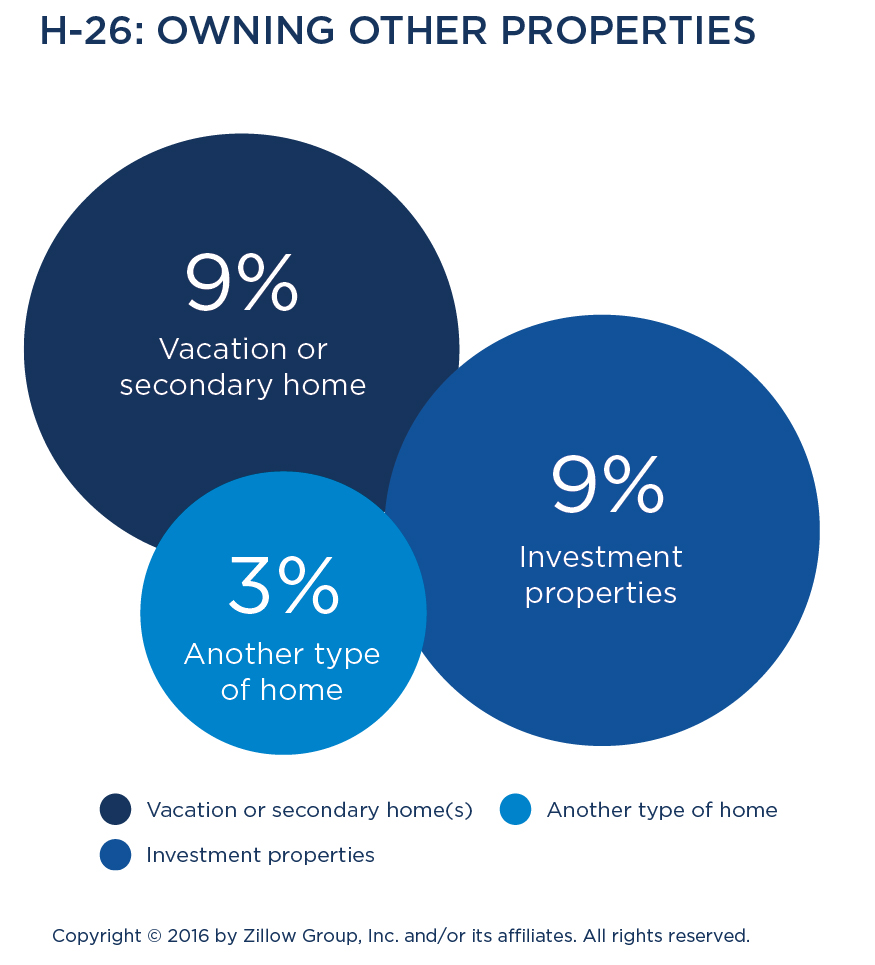
Nearly one in five homeowners (18 percent) own an additional property beyond their primary residence. This is comprised of investment properties (9 percent) and vacation or secondary homes (9 percent). Repeat owners of a primary property (22 percent), men (21 percent) and families (20 percent) are more likely than their respective counterparts to own additional property.
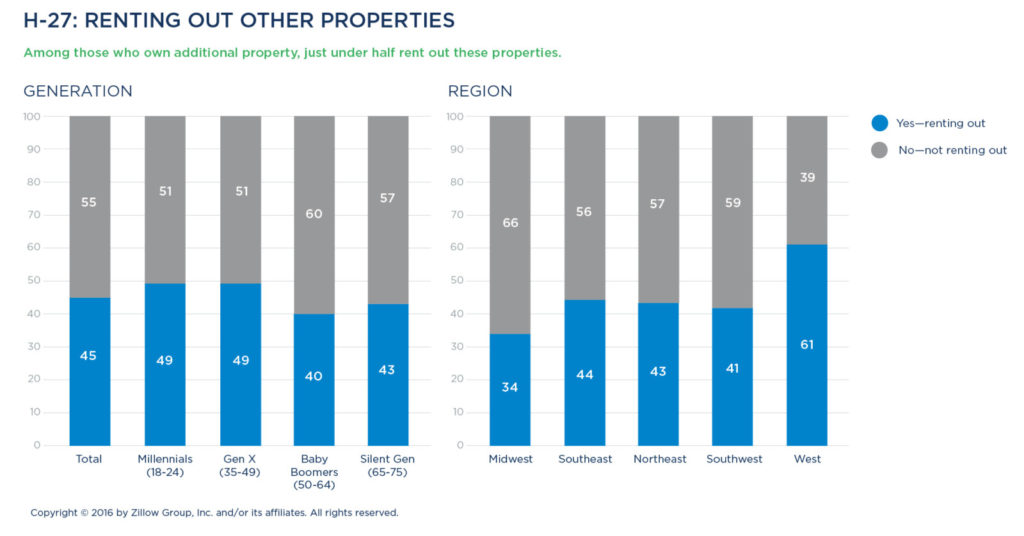
Nearly half (45 percent) of those with additional property choose to rent them out. Renting other properties is highest in the West (61 percent), among those raising children at home (51 percent), and among Millennials or members of Generation X (49 percent for each).
LOOKING AHEAD & NEXT STEPS
Home improvement projects

The typical homeowner has plans to do at least three maintenance projects over the next three years. Common plans include painting (44 percent), upgrading flooring (31 percent) and updating kitchens (26 percent). Ambitious Millennials and families are the most likely to have five or more projects in the pipeline (both 27 percent), while members of the Silent Generation are most likely to have none (23 percent). By gender, men tend to prioritize structural repairs while women focus on aesthetic improvements.
Likelihood to sell
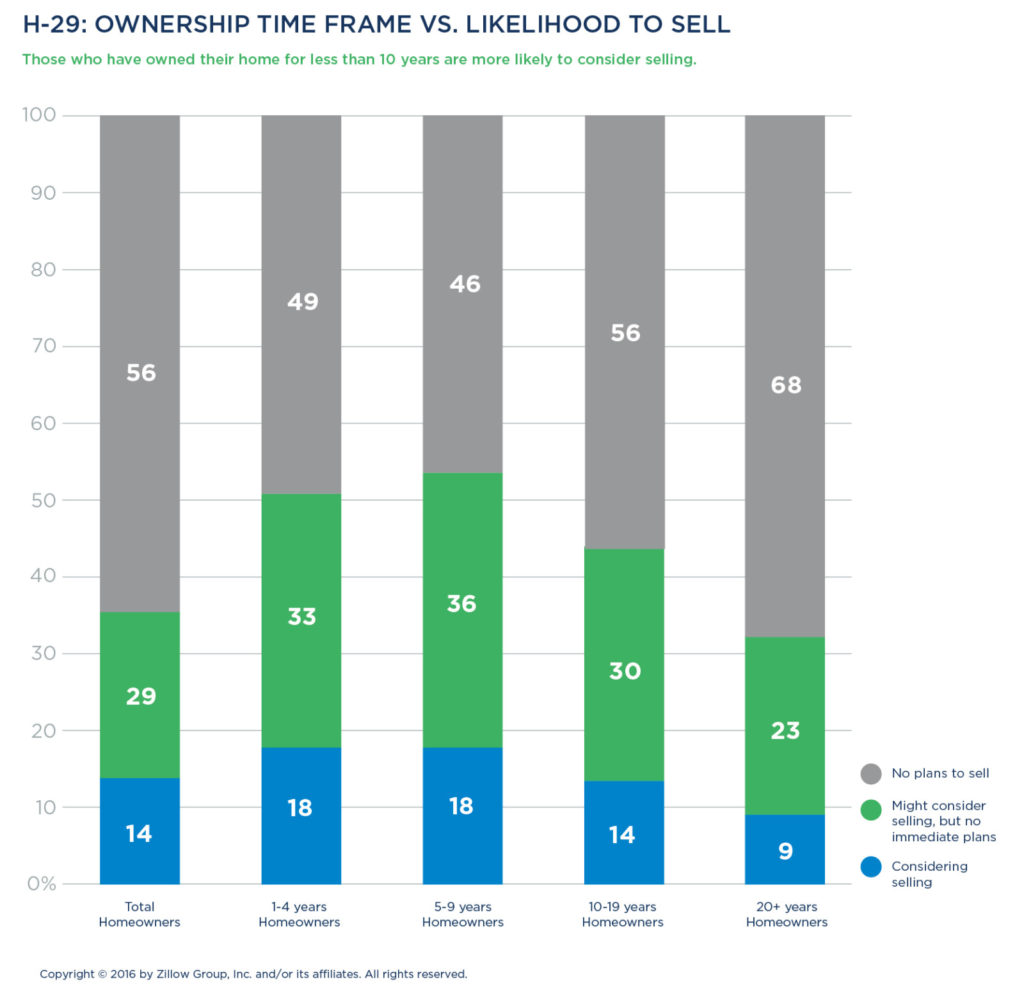
As time passes, homeowners periodically weigh whether it’s better to stick with the home they own or list it for sale. The majority have no firm plans to sell (86 percent), however 29 percent might consider selling at some point. Twelve percent are considering selling in the next three years, and 2 percent have their home currently on the market. Millennials (22 percent), those with children at home (18 percent), and those living in an urban area (20 percent) are more likely to have plans to sell.

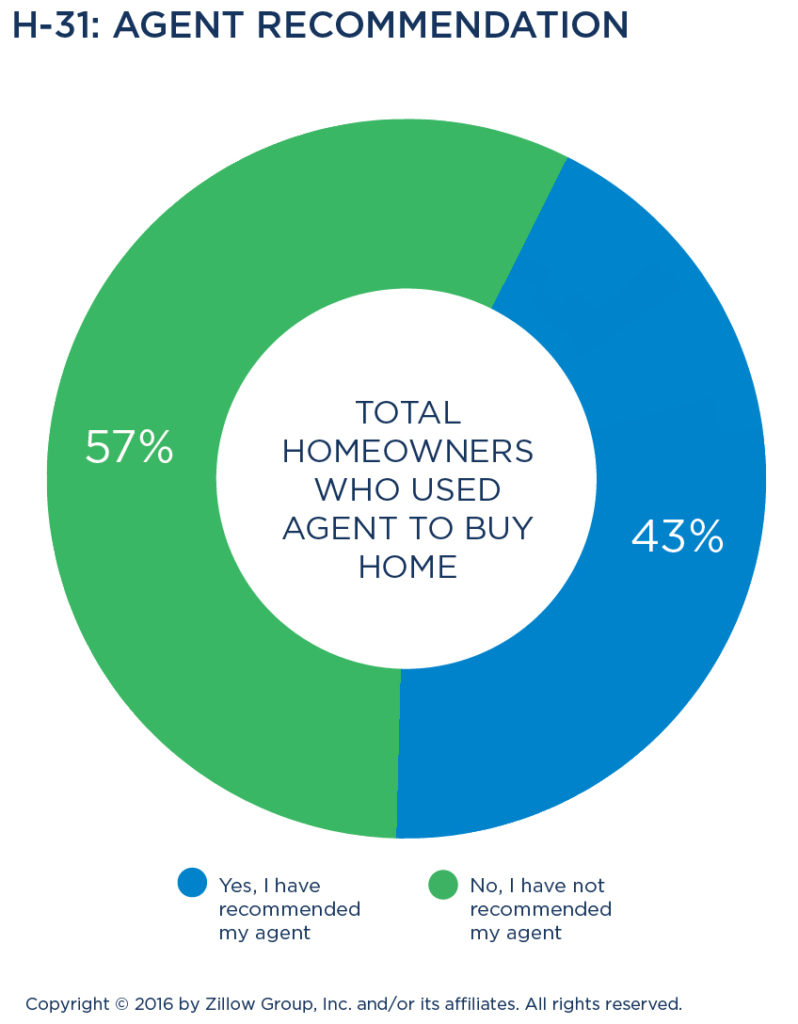 Communicating with agents
One in four homeowners (26 percent) say they keep in touch with the agent through whom they purchased their home, 20 percent indicate occasional contact, and 6 percent cite regular communication. Millennials (40 percent) are the most likely to stay in touch with their agent, compared to 32 percent of Generation X, 18 percent of Baby Boomers and 19 percent of the Silent Generation. Men are also more likely to keep in contact with their agent—31 percent do, compared to 21 percent of women. Additionally, owners planning to sell indicate a higher incidence of agent contact (48 percent, 15 percent of which is regular contact), perhaps in anticipation of hiring their agent for a listing or to seek an agent’s advice about pre-sale home projects.
Word of mouth is helpful to buyers and sellers when choosing an agent, and just under half (43 percent) of all owners have recommended their agent. Among those most likely to refer their agent are Millennials and Generation X (55 percent and 49 percent respectively, versus 35 percent of Baby Boomers and 36 percent of the Silent Generation), households with children (57 percent, versus 39 percent of those without kids), and those living in an urban locale (49 percent, versus 43 percent of suburban owners and 36 percent of rural owners).
Today’s Renter
Today’s renter is aware of the dynamic housing market—and nearly six out of 10 renters consider both renting and buying. Nearly half of all renters consider living in a single-family home, but less than one-third actually do, a factor that may contribute to renters’ interest in homeownership.
Finding a new rental takes an average of 10.4 weeks—and up to 12 weeks for those with lower household incomes. Eight out of 10 renters use online resources in their home search, and most reach out to at least four landlords or property managers in the process of searching for their new place. More than 20 percent of renters will give up on a property if they don’t receive a response to their inquiry in what they consider to be a timely manner, which for most is within 24 hours.
Renters typically sign leases with a length of 12 months. They prioritize finding a place that fits within their budget, is in a safe neighborhood, and takes their pets, sacrificing other features such as square footage, a yard, garage or view in favor of a home they can afford in their desired location.
RENTER CHARACTERISTICS & CONSIDERATIONS
Most earn less than $50,000
Renters are defined as people who moved to a home that they rent within the last year, which includes the main decision-makers and other household members who had a say in the decision.
Today’s typical renter is most often female (57 percent), Caucasian (52 percent) and part of a household earning below $50,000 annually (58 percent). Eighty-four percent of renters are below age 50, making them Millennials (56 percent) or members of Generation X (28 percent).

Among generations:
- Millennial renters represent more than half of all renters (56 percent), and they are often women (59 percent), more likely than older generations to be Latino/Hispanic (23 percent), and include adults across all income levels.
- Generation X renters represent approximately one out of three renters (29 percent). This generation is balanced by gender (47 percent male versus 53 percent female) and more likely to be black/African-American (21 percent) than other generations. Nearly a third (29 percent) earn above $75,000 a year, representing the highest proportion of wealthier renters among the generations.
- Sixty-one percent of Baby Boomers who rent are women, most bring in below $50,000 (61 percent), and most are Caucasian (66 percent).
- Silent Generation renters are balanced by gender (49 percent male/51 percent female) and are most often Caucasian (72 percent) or black/African-American (17 percent). Nearly three out of four (72 percent) are living on household incomes below $50,000, suggesting they are drawing on Social Security or a fixed retirement income.
In terms of household composition, six in 10 (59 percent) are living with a spouse/partner, and four in 10 have children under the age of 18. One in three renters has at least one pet (35 percent), comprised primarily of cats (16 percent), small dogs (15 percent) and medium/large dogs (12 percent).
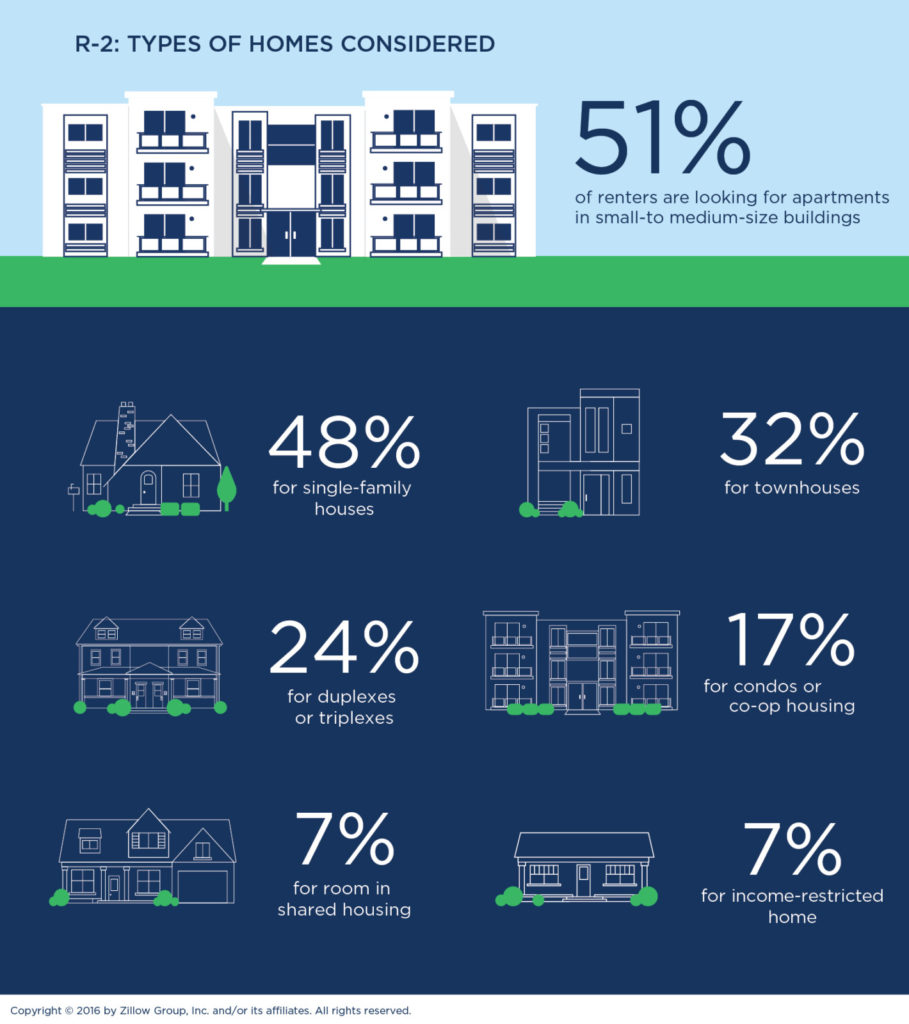 Home shopping a shared effort
More than four out of five renters (82 percent) are co-shopping for a home with either a romantic partner (53 percent) or roommate-to-be (20 percent). Most (88 percent) of renters age 24 or younger are searching for a home they intend to share.
Typical home search takes two to three months
The average renter spends 10.4 weeks searching for a home. Generally speaking, the higher a renter’s income, the faster they tend to find a new home. Renters earning over $75,000 secure a place in fewer than 10 weeks on average, while those earning under $25,000 need nearly 12 weeks on average to find a new home.
Renters seek single-family homes
Like buyers, renters’ first choice is a single-family home (48 percent). However, renters’ consideration of stand-alone houses is less pronounced than that of buyers (83 percent). More than half (51 percent) of renters are looking at units in small or mid-sized buildings, and about one-third (32 percent) consider townhouses.
Renters also consider larger buildings with more than 50 units (30 percent), duplex/triplex units (24 percent) or a condo/co-op (17 percent). Just 7 percent are considering applying to live in income-restricted rental housing.
Many generational trends exist when considering types of rental homes:
- Millennials are most willing to move into apartment buildings of any type—large, medium-sized, small—or into townhouses.
- Generation X renters are most interested in single-family home rentals (54 percent) but are also open to living in apartment buildings.
- Baby Boomers are the population most likely to consider living in a duplex or triplex (26 percent).
- Silent Generation renters are more likely to consider “other” housing (19 percent), possibly because some senior housing doesn’t fit conventional rental parameters, or to rent income-restricted properties (12 percent) as many live on fixed incomes in retirement.
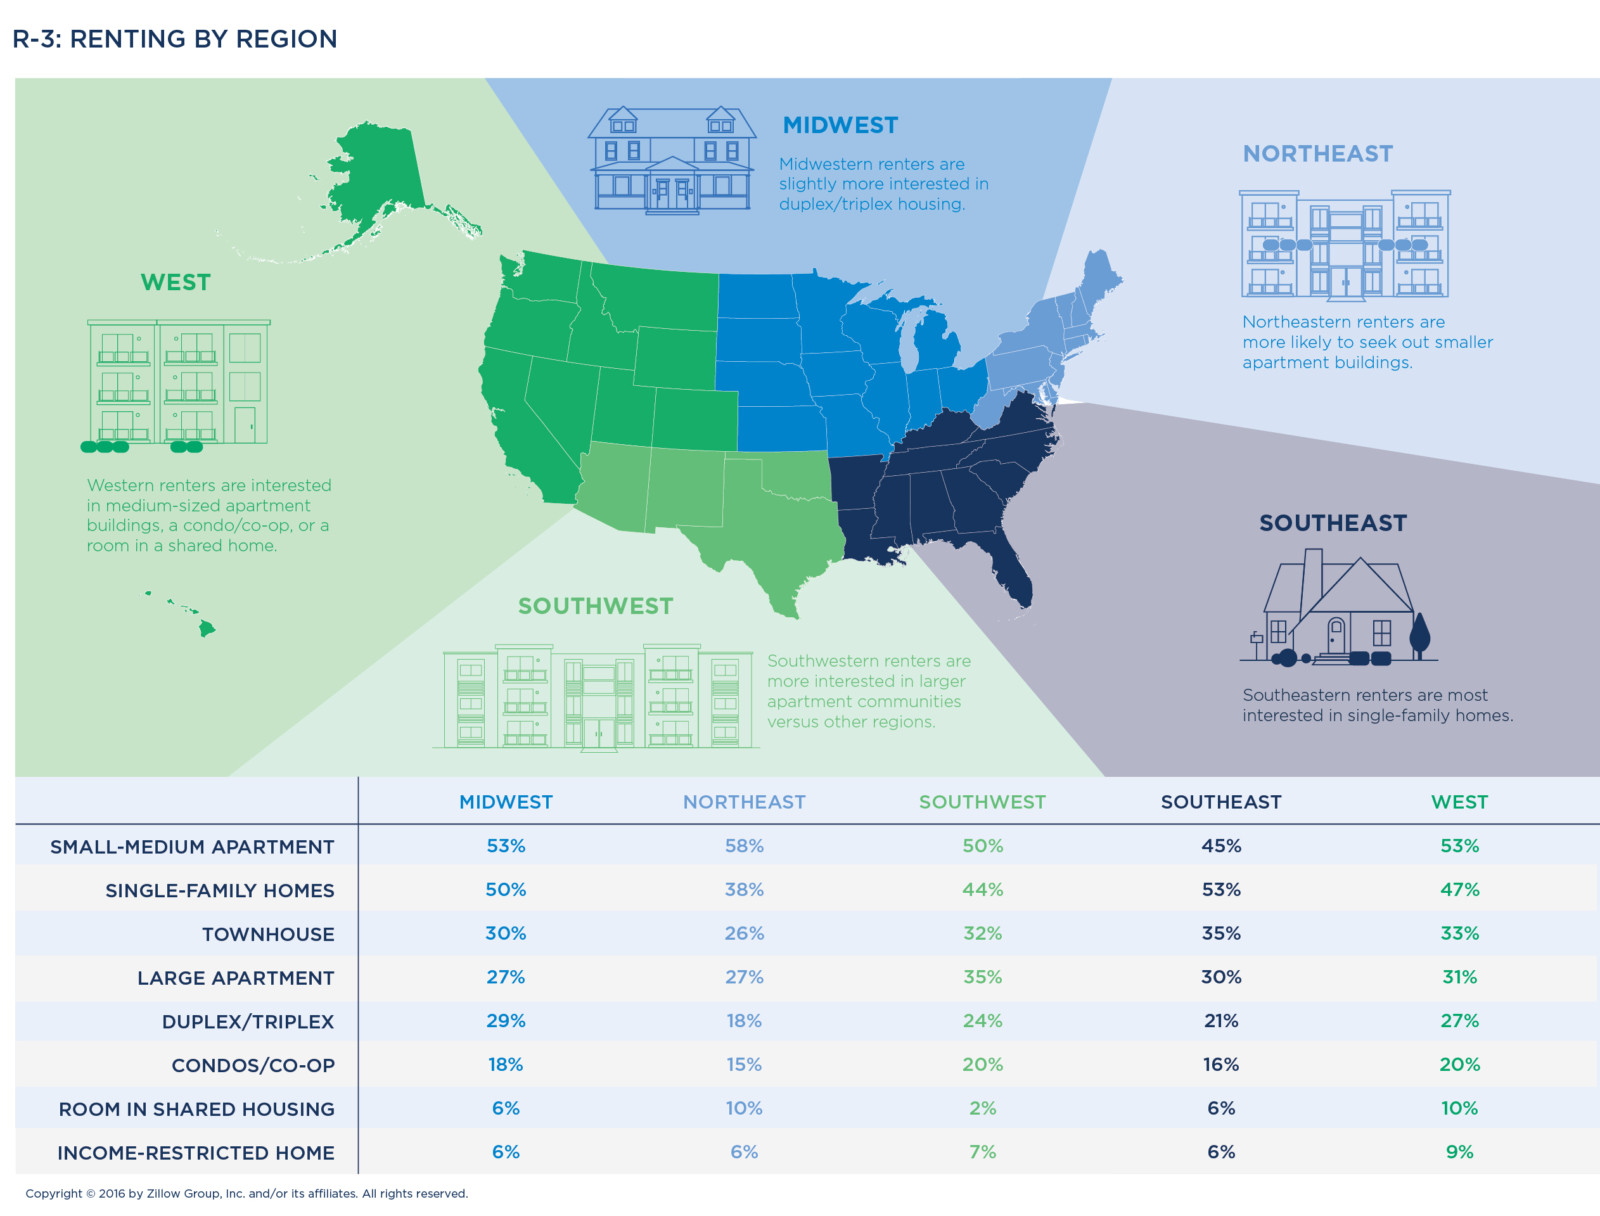
Regionally, renters in the Southeast and Midwest seek the space afforded by single-family homes, while renters in the expensive and dense Northeast and West look to smaller buildings, sharing a home, or income-restricted options to make the rent more affordable. Those in the Southwest appear to seek the amenities of larger rental communities.
- Northeast renters are among those most likely to seek out small apartment buildings (58 percent) or to rent a room in a shared home (10 percent).
- Southeast renters seek space, and are among the most interested in single-family homes (53 percent) or townhouses (35 percent).
- Midwest renters show the most interest in duplex/triplex housing (29 percent). They are also among the most interested in single-family homes (50 percent) and smaller apartment buildings (41 percent).
- Southwest renters are the most interested in larger apartment communities (35 percent) or renting a condo or co-op (20 percent).
- Western renters express considerable interest in small- to medium-sized apartment buildings (53 percent), a condo or co-op (20 percent), or economizing by living in a room in a shared home (10 percent) or in an income-restricted property (9 percent).
More than half consider buying instead
More than half (58 percent) of all renters in the market for a new rental home are also considering buying a place—with 19 percent seriously looking to buy and 39 percent casually considering it. This is particularly true for Millennials and members of Generation X (63 percent and 59 percent, respectively).
Among adults over 50 who rent, the majority (57 percent of Boomers, 68 percent of the Silent Generation) do not consider buying at all.
SEARCHING & SHOPPING RESOURCES
Online resources and rental professionals most common
Finding a rental home can be challenging, as inventory fluctuates along with national and regional economic trends. Any renter hitting the market during a local industry’s hiring boom, shopping for a home in a college town near the launch of the academic year, or seeking a house in a popular school district or trendy neighborhood will face steep competition.
Four out of five renters use online resources to assist in their home search (84 percent), which is the most commonly used resource. This is followed by direct contact with the property owners/landlords (62 percent), and referrals by friends, relatives or neighbors (59 percent). Over half (53 percent) also consider property managers or leasing agents to be resources during their search.

Online resources accessed in a variety of ways
When it comes to technology’s role in connecting renters with new homes, most renters are using their desktop computers (74 percent) to search for homes, followed by mobile sites (59 percent) and apps (43 percent). Millennials are the most bullish on mobile search, with three out of four turning to mobile (76 percent), versus just 61 percent of Generation X renters, over a third of Baby Boomers (35 percent) and one in four Silent Generation renters (24 percent).
Here’s how renters approach their home search, by generation:
- Millennial renters turn first to technology. They are the generation most likely to use online resources (90 percent), particularly via mobile access (76 percent), and are more likely than those age 35 or older to reach out to their friends, relatives and neighbors for advice (62 percent).
- Generation X turns to the internet and landlords. They rely most on online tools (84 percent) and direct landlord or owner contact (63 percent). Additionally, four in 10 pay attention to yard or open house signs (38 percent), which is on par with Millennials and higher than those 50 and over (33 percent for Baby Boomers, 26 percent for Silent Generation).
- Baby Boomers mix internet research and human contact. They use the internet (67 percent), talk to landlords (66 percent) and reach out to property managers (56 percent). They are the generation most likely to notice print ads (40 percent).
- Silent Generation renters rely on people first, technology second. They predominantly turn to property managers/leasing agents (64 percent) and landlords/owners (62 percent), with half (54 percent) also using online tools and one in four using mobile (24 percent).
The role of property managers and landlords
Rental properties are typically managed by two types of individuals—the property owner/landlord or a hired property manager.
Bigger properties are more likely to be institutionally owned and to employ a management company or on-site property manager. Smaller buildings, single-family homes and stand-alone units (condos, townhouses) are often owned by individuals or landlords who rent out these properties as a livelihood or as a side business; these properties may be marketed and rented by their owners or by a management company or agent the owner has hired.

Half of all renters wind up living in a space that is not managed by a property manager. When they do, most often this manager lives on-site (62 percent). The larger the building, the more likely it will feature an on-site property manager, with more than two-thirds (79 percent) of renters in these buildings indicating their manager lives on-site.
Just under half (46 percent) of all renters wind up renting from a landlord, although more than six in 10 use landlords as a resource when searching for a property. Renters of single-family homes, however, deal with landlords 70 percent of the time.
Fast response times are critical
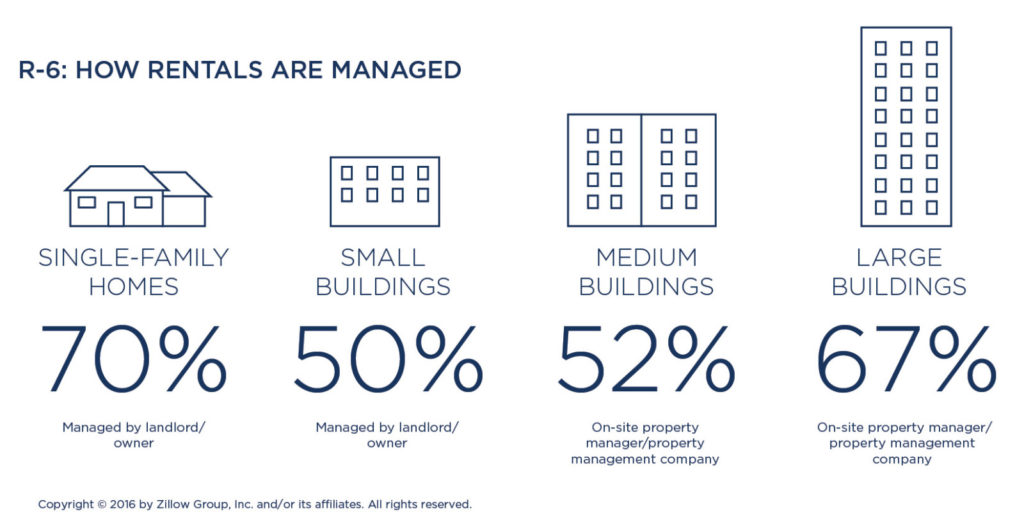
Today’s renters have to cast a wide net to find a new place, contacting a variety of property managers and landlords and crossing their fingers for a fast response. The average renter contacts 4.7 landlords or property managers. Older Millennial renters reach out to the most rental professionals, contacting an average of 5.3 landlords or property managers.
Since most renters are working on a short timeline—about two to three months—to locate and move into a property, response time is critical to renters.
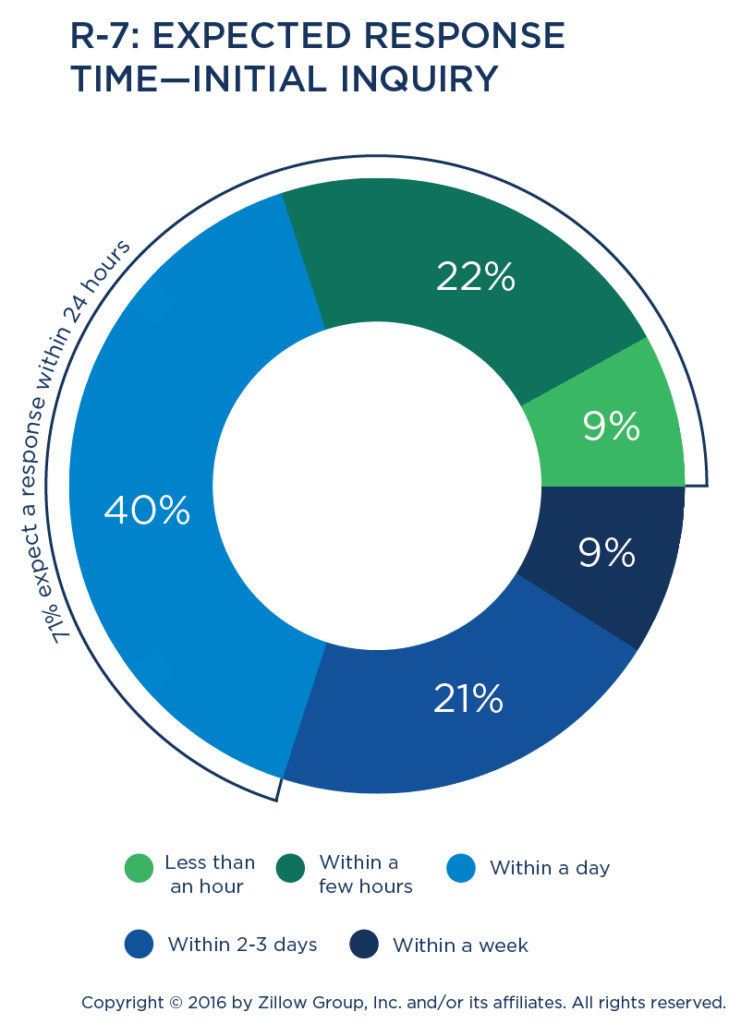
Following an initial query by a renter, nearly one in three (31 percent) expect to hear back from the property manager or landlord within hours, and the majority (71 percent) expect to hear back within one day.
If a renter does not receive a response from a rental professional within their expected timeframe, the most common next step is to contact them again via a phone call (45 percent). However, one in five (22 percent) choose to immediately move on to another rental property they’ve set in their sights.

Additional next steps by the prospective renter include emailing the rental professional (14 percent), making an in-person visit to the property or manager’s office (13 percent), or sending a text message (5 percent).
Snapshot: Long-Term Renters
The homeownership rate has steadily declined to generational lows over the past decade, keeping a broad swath of renters—from all social and economic backgrounds—in the rental market for more than a year.
Financial hurdles
There are a number of factors driving this shift, including tight home inventory. When faced with hurdles of high prices and a limited number of less expensive homes on the market, many renters aren’t financially qualified to buy. Almost 70 percent of long-term Millennial renters and 62 percent of long-term Generation X renters earn less than $50,000 per year, likely making homeownership unaffordable.
That said, many renters who could likely afford to purchase a home in their market are opting to stay in a rental instead of buying: 15 percent of Millennials renting long-term and 22 percent of Generation X long-term renters earn $75,000 or more per year.
An evolving economy is also having an impact. Some locally booming labor markets—driven by tech or, until recently, energy—have attracted affluent newcomers who tend to rent before deciding whether to settle permanently. The highest percentage of long-term renters are in the Southeast (28 percent) and West (25 percent). The Southwest has the lowest percentage at 10 percent.
Demographic trends
There are also long-term demographic trends at play. Young adults are waiting longer to buy homes as they put off many of the decisions and events that typically accompany homeownership, including getting married and starting families—and many are content where they are renting.iv
Forty percent of long-term renters have no plans to move within the next three years. Millennials are the most likely to have plans to move in the next year, while one-third of Gen X renters (33 percent), nearly one-half of Boomer renters (45 percent) and more than half of renters in the Silent Generation (60 percent) are not planning to move to a new home within the next three years.
In general, long-term renters are happy with their current living situation (46 percent), and nearly half are satisfied with the price they pay (46 percent) and the area in which they live (49 percent). In addition, one-third (33 percent) said they want to avoid going through the stressful process of moving.
Renters who have plans to buy a home in the future tend to be a little less satisfied with their rental: Only 30 percent claimed to be happy in their current living situation. Hopeful buyers do tend to pay a bit more for their rent (median monthly rent payment of $900 per month versus $750 for those with no plans to move), and only 32 percent are happy with the rental price they are paying.
Deciding to move
The longer the renter tends to live in the rental, the harder it may be to eventually decide to move. More than half (56 percent) of renters not looking to move have rented for five or more years; and just over a quarter (26 percent) have rented for three to four years.
Renting for the long haul
Of long-term renters who are planning to move within the next three years, the majority—55 percent—plan to find a new rental when they move. This is even more prevalent with Young Millennials (62 percent) and members of the Silent Generation (69 percent)—perhaps due to financial constraints. Forty percent of long-term renters hope to be purchasing a home when they move. Families and those with children in the household who have been renting long-term are more likely to plan to move to a purchased home, at 47 percent and 51 percent, respectively.
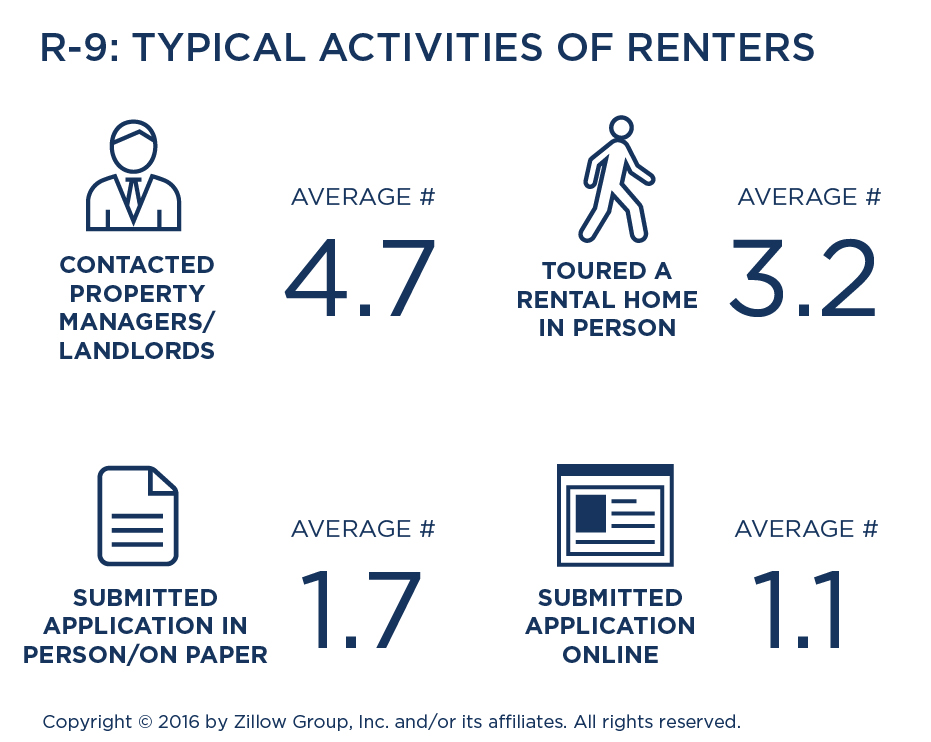 RENTAL SELECTION & LEASING FACTORS
Evaluating prospective rentals
Like buyers, renters take in-person tours of properties. They also must reach out to property owners or managers and submit their application (with credit score, income and employment status) while working against the clock.
As with buyers, renters don’t often seal the deal on their first attempt. The typical renter contacts five property managers or landlords, takes three home tours and submits three applications for a rental.
The younger the renter, the more effort is typically expended, with Millennial renters contacting more property managers (around five). Silent Generation renters reach out to fewer property representatives, take fewer home tours (typically one) and submit fewer rental applications (one to two, on average).
To evaluate prospective properties, four out of five renters (82 percent) place importance on taking in-person home tours to get a sense of the space—this is especially important for those with children (86 percent). The majority (82 percent) also want to know lease terms and rules before committing, and many want to meet rental management—especially if renting a single-family home from a landlord (64 percent).
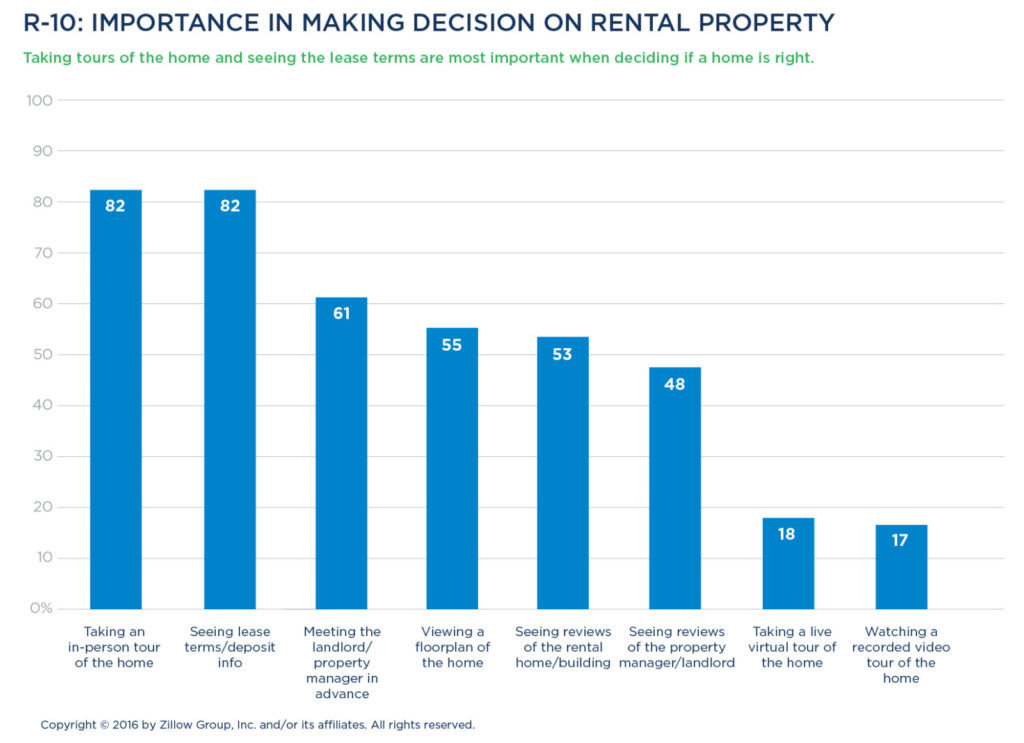
Renters also place importance on management company reviews (48 percent), especially those living in larger buildings (62 percent). Large-building renters are also more interested in floor plans (68 percent) and consumer reviews of a building (69 percent).
Affordability and safety are most important
Renters value some but not all of the same property traits that buyers do. Their top priority when seeking a home is finding a place that fits their budget (95 percent), with neighborhood safety a close second concern (90 percent), mirroring buyers’ priorities. Also important: finding a place that accepts pets (45 percent). For renters, these three traits are more important than size or a location near the renter’s workplace or in a preferred neighborhood.
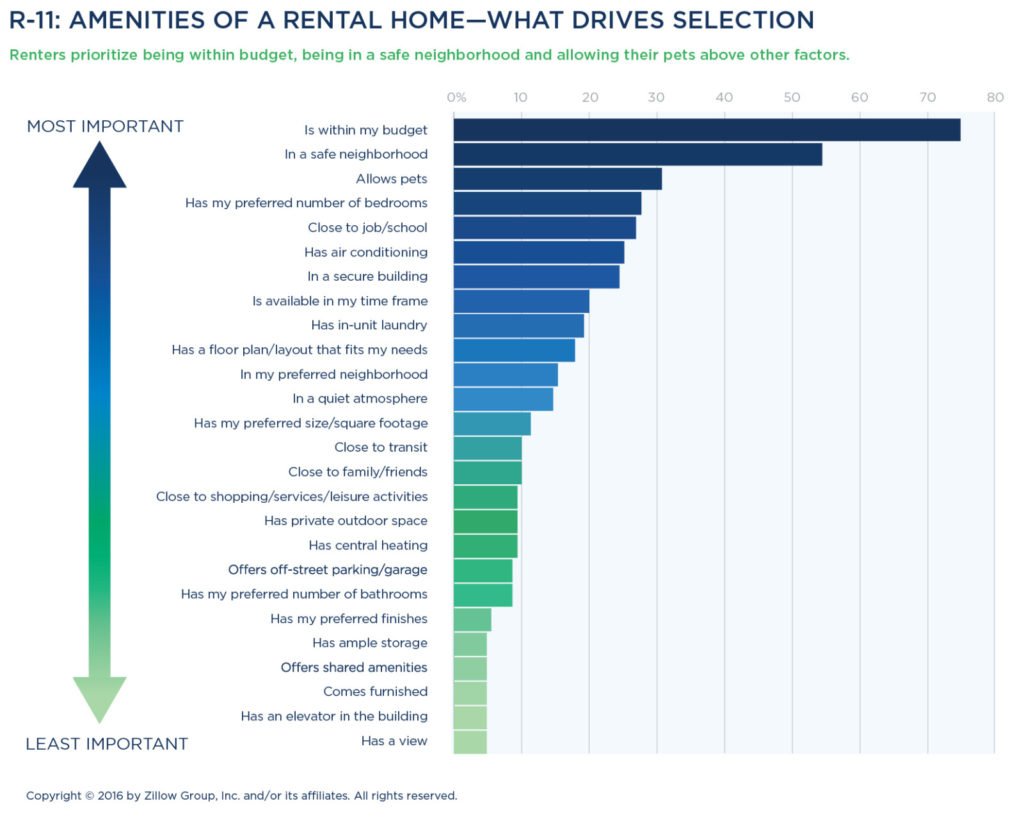
Renters appreciate but don’t always require air conditioning, in-unit laundry and finding a place with their desired square footage—since their top priority is finding a rental that’s within budget, these may be amenities they’d sacrifice to get into an affordable home.
Knowing that they may not be in this home forever, renters don’t place as much weight on whether their home has outdoor space, or if it is located near their family or friends, particular services, or transit. Only a minority of renters say finishes, views, in-building storage or parking are priorities.
Where renters land

Renters live in a wide variety of housing types. While single-family homes are considered by nearly half of renters, fewer than three in 10 renters end up in this type of home. More than half of all renters live in multiunit dwellings with fewer than 50 residences, a housing category which includes smaller apartment buildings, townhouses, condominiums or a unit within a duplex/triplex property. A small portion of the renting population shares a space with roommates or lives in income-restricted housing.
Renters with different ethnic backgrounds gravitate toward different types of properties. Caucasian renters are more likely to rent a single-family home, with one in three (33 percent) living in this type of rental, compared to one in four blacks/African-Americans and Latinos/Hispanics (24 percent for both). Asian/Pacific Islander renters show the highest preference for larger apartment buildings, with nearly one in four (24 percent) choosing this type of housing.
Among generations, Generation X renters show a higher incidence of living in single-family houses, with one in three (33 percent) leasing such homes. Millennial renters, meanwhile, are the generation most likely to rent in a larger or medium-sized apartment. Baby Boomer renters show a higher incidence of renting in a duplex/triplex unit or living in income-restricted properties.
Characteristics of homes rented
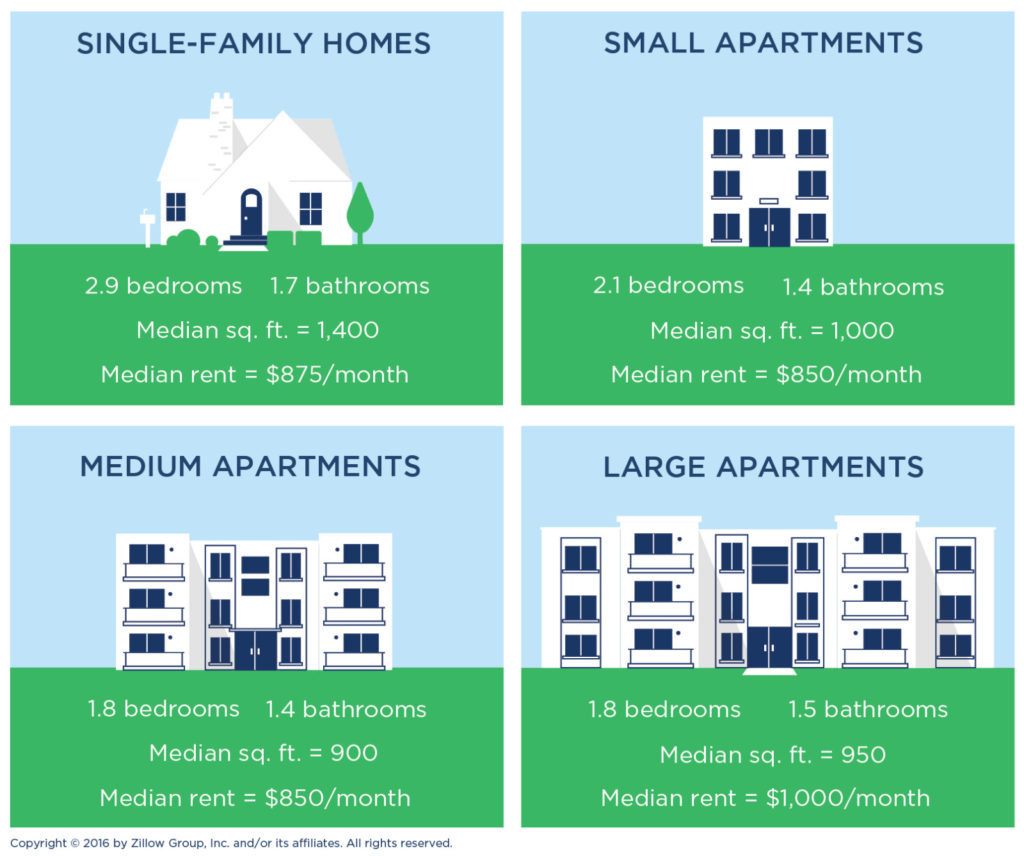
Interestingly, single-family homes are sometimes cheaper to rent than apartments. Here’s a look at the average home among multiple types commonly chosen by renters:
- Single-family homes have the biggest footprint (1,400 square feet), median rent of $875 per month, and have three bedrooms, two baths, and occasionally a partial bathroom.
- Apartments in small buildings (under 10 units) have the highest bedroom count among apartment building types. These units have a median of 1,000 square feet, median rent of $850 per month, and have two bedrooms, one bathroom, and sometimes a partial bath.
- Apartments in medium-sized buildings (10-49 units) cost a median of $850 per month, are typically 900 square feet, and have two bedrooms, one bathroom, and occasionally a partial bathroom.
- Apartments in large buildings (50+ units) have a median of 950 square feet, median rent of $1,000 per month, and feature two bedrooms, two bathrooms, and sometimes a partial bathroom.
Renters in Western states pay the most ($1,100 median rent), followed by those in the Northeast ($1,000 median rent), Southwest ($875), Southeast ($800) and Midwest ($714).
Most renters stay local
Renters aren’t often moving far. The majority of renters (86 percent), like their buyer peers (90 percent), are moving within the state, with more than half (57 percent) staying in their current city. Only one in 10 renters (13 percent) is leaving their home state, but among those interstate movers are many from the Silent Generation (24 percent).
Renters are less likely than buyers to wind up living where they initiated their search. While some 85 percent of buyers ended their home search where they started it, that’s less often the case for renters (74 percent wind up where they first looked). Silent Generation renters, in particular, have a higher incidence of moving to a location that wasn’t on their initial consideration list (37 percent, versus 26 percent for renters in general).

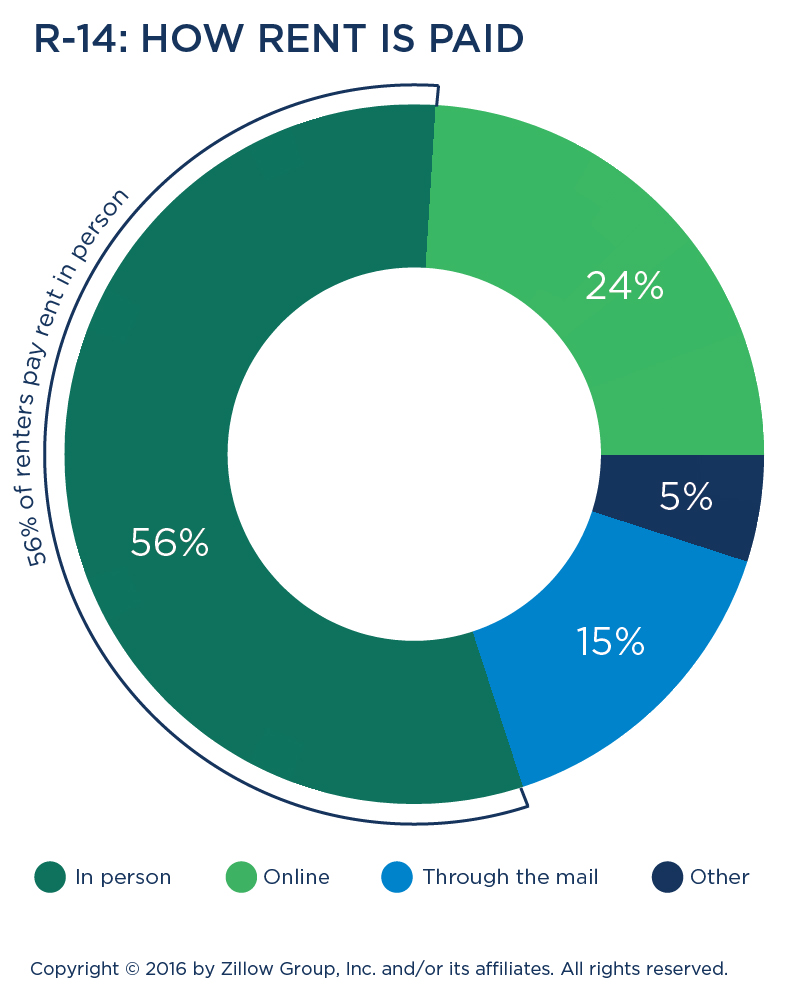 Yearly leases typical
Six out of 10 (61 percent) renters sign a 12-month lease, with a minority (14 percent) signing a month-to-month lease or no lease at all (5 percent). Fewer than one in 10 renters (nine percent) commits to a lease term longer than 12 months.
Most renters sign their leases in person (85 percent) versus electronically (15 percent), with about 20 percent of both Millennial renters and those in larger buildings completing the contract electronically. Most renters (56 percent) also pay their rent in person, especially among the Silent Generation (66 percent).
One in four renters (24 percent) pays rent online, and Millennials (27 percent) and renters in medium-to-large buildings (32 percent and 38 percent respectively) are more likely to do so. Of those paying online, six out of 10 (59 percent) pay via a property manager’s website—and 83 percent pay this way in large buildings. Others pay rent via their bank or a peer-to-peer pay platform. Just 15 percent of renters pay via postal mail.
Exhibit List
Today’s Home Buyer
|
Today’s Home Seller
|
| Exhibit B-1 |
TODAY’S HOME BUYER |
Exhibit S-1 |
TODAY’S HOME SELLER |
| Exhibit B-2 |
FIRST-TIME OR REPEAT BUYERS |
Exhibit S-2 |
FIRST-TIME OR REPEAT SELLERS |
| Exhibit B-3 |
CO-SHOPPING |
Exhibit S-3 |
CO-SELLING |
| Exhibit B-4 |
TYPES OF HOMES CONSIDERED |
Exhibit S-4 |
KEY LIFE EVENTS EXPERIENCED IN PAST TWO YEARS |
| Exhibit B-5 |
HOME BUYING BY REGION |
Exhibit S-5 |
HOMES SOLD VS. HOME PURCHASED |
| Exhibit B-6 |
CONSIDERED BRAND-NEW HOMES |
Exhibit S-6 |
TIMELINE OF SELLER ACTIVITIES |
| Exhibit B-7 |
ALSO CONSIDERED RENTING |
Exhibit S-7 |
MEDIAN SALE PRICE BY REGION |
| Exhibit B-8 |
TOP RESOURCES USED TO SEARCH, SHOP OR PURCHASE |
Exhibit S-8 |
TYPE OF HOME SOLD BY GENERATION |
| Exhibit B-9 |
DIGITAL RESOURCES |
Exhibit S-9 |
LENGTH OF TIME CONSIDERED SELLING BEFORE LISTING |
| Exhibit B-10 |
ONLINE RESEARCH BY GENERATION—ALL DEVICES |
Exhibit S-10 |
PRE-SALE RENOVATIONS BY GENERATION |
| Exhibit B-11 |
BUYERS WHO CONSIDERED MORE THAN ONE AGENT |
Exhibit S-11 |
TASKS COMPLETED TO READY FOR LISTING |
| Exhibit B-12 |
HOW BUYERS FIND AN AGENT |
Exhibit S-12 |
NUMBER OF TIMES SELLING ACTIVITIES OCCURRED |
| Exhibit B-13 |
EXPECTED RESPONSE TIME—INITIAL INQUIRY |
Exhibit S-13 |
NUMBER OF TIMES LIST PRICE CHANGED |
| Exhibit B-14 |
HOW BUYERS EVALUATE AN AGENT |
Exhibit S-14 |
TOP FIVE SELLER REGRETS |
| Exhibit B-15 |
IMPORTANT FACTORS WHEN SELECTING AN AGENT |
Exhibit S-15 |
SELLING EXPERIENCE |
| Exhibit B-16 |
PREFERRED METHOD OF COMMUNICATION WITH AGENT |
Exhibit S-16 |
RESOURCES USED TO SELL HOME |
| Exhibit B-17 |
IMPORTANCE OF AGENT SERVICES |
Exhibit S-17 |
DIGITAL RESOURCES |
| Exhibit B-18 |
AVERAGE NUMBER OF HOME SEARCH ACTIVITIES |
Exhibit S-18 |
WHEN SELLERS INVOLVE AN AGENT |
| Exhibit B-19 |
AMENITIES OF A HOME—WHAT DRIVES HOME SELECTION |
Exhibit S-19 |
HOW SELLERS FIND AN AGENT |
| Exhibit B-20 |
TYPE OF HOME CHOSEN |
Exhibit S-20 |
IMPORTANT ATTRIBUTES WHEN SELECTING AN AGENT |
| Exhibit B-21 |
REASONS FOR CHOOSING A CONDO |
Exhibit S-21 |
IMPORTANCE OF AGENT SERVICES |
| Exhibit B-22 |
PRICE OF HOME VS. INITIAL BUDGET |
Exhibit S-22 |
AGENT COMPENSATION |
| Exhibit B-23 |
HOME IMPROVEMENTS |
Exhibit S-23 |
NEGOTIATION WITH AGENT |
| Exhibit B-24 |
REASONS FOR PURCHASING BRAND-NEW HOME |
Exhibit S-24 |
SELLERS WITHOUT AN AGENT |
| Exhibit B-25 |
DISTANCES BUYERS MOVE |
Exhibit S-25 |
REASONS FOR SELLING ON THEIR OWN |
| Exhibit B-26 |
HOME IN A COMMUNITY WITH SHARED AMENITIES |
Exhibit S-26 |
RESOURCES USED TO DETERMINE LIST PRICE |
| Exhibit B-27 |
WHO GETS PRE-APPROVED |
|
|
| Exhibit B-28 |
USE OF ONLINE FINANCIAL RESOURCES |
|
|
| Exhibit B-29 |
MORTGAGE VS. PAID CASH |
|
|
| Exhibit B-30 |
SOURCE OF DOWN PAYMENT |
|
|
| Exhibit B-31 |
SAME PROVIDER AS PRE-APPROVAL |
|
|
| Exhibit B-32 |
RESOURCES USED TO FIND A LENDER |
|
|
| Exhibit B-33 |
COMMUNICATION WITH LENDERS |
|
|
| Exhibit B-34 |
NUMBER OF LENDERS CONTACTED |
|
|
| Exhibit B-35 |
IMPORTANT ATTRIBUTES WHEN SELECTING A LENDER |
|
|
Today’s Homeowner
|
Today’s Renter
|
| Exhibit H-1 |
TODAY’S HOMEOWNER |
Exhibit R-1 |
TODAY’S RENTER |
| Exhibit H-2 |
HOMEOWNER ETHNICITY BY GENERATION |
Exhibit R-2 |
TYPES OF HOMES CONSIDERED |
| Exhibit H-3 |
INCOME RANGES BY REGION |
Exhibit R-3 |
RENTING BY REGION |
| Exhibit H-4 |
HOW OWNERS VIEW THEIR HOMES |
Exhibit R-4 |
RESOURCES USED TO SEARCH & SHOP |
| Exhibit H-5 |
WHO LIVES IN THE HOME |
Exhibit R-5 |
HOW RENTALS ARE MANAGED |
| Exhibit H-6 |
LOCATION—URBAN, RURAL OR SUBURBAN |
Exhibit R-6 |
NUMBER OF CONTACTS MADE WITH RENTAL PROFESSIONALS |
| Exhibit H-7 |
AGE OF HOMES OWNED |
Exhibit R-7 |
EXPECTED RESPONSE TIME—INITIAL INQUIRY |
| Exhibit H-8 |
INITIAL CONDITION OF HOME |
Exhibit R-8 |
NEXT STEPS IF NO RESPONSE WITHIN EXPECTED TIME FRAME |
| Exhibit H-9 |
RENOVATIONS AND IMPROVEMENTS MADE |
Exhibit R-9 |
TYPICAL ACTIVITIES OF RENTERS |
| Exhibit H-10 |
RESOURCES USED FOR IMPROVEMENTS |
Exhibit R-10 |
IMPORTANT FACTORS WHEN EVALUATING RENTAL HOMES |
| Exhibit H-11 |
DIY VS. HIRING A PRO |
Exhibit R-11 |
AMENITIES OF A RENTAL HOME—WHAT DRIVES SELECTION |
| Exhibit H-12 |
PROJECTS HOMEOWNERS MOST LIKELY TO DIY |
Exhibit R-12 |
TYPE OF RENTAL HOME CHOSEN |
| Exhibit H-13 |
HOW OWNERS PAID FOR IMPROVEMENTS |
Exhibit R-13 |
TYPES OF LEASES |
| Exhibit H-14 |
INITIAL BUDGET VS. FINAL BUDGET |
Exhibit R-14 |
HOW RENT IS PAID |
| Exhibit H-15 |
INITIAL EXPECTATIONS VS. FINAL OUTCOME |
|
|
| Exhibit H-16 |
APPROACH TO ONGOING MAINTENANCE |
|
|
| Exhibit H-17 |
PROJECTS COMPLETED BY PROFESSIONALS |
|
|
| Exhibit H-18 |
MOST CHALLENGING ASPECTS OF OWNING |
|
|
| Exhibit H-19 |
MORTGAGE VS. PAID OFF |
|
|
| Exhibit H-20 |
REFINANCED HOME—YES OR NO |
|
|
| Exhibit H-21 |
REASONS FOR REFINANCING |
|
|
| Exhibit H-22 |
WHEN OWNERS REFINANCED |
|
|
| Exhibit H-23 |
HOW OWNERS FOUND LENDER |
|
|
| Exhibit H-24 |
IMPORTANT ATTRIBUTES WHEN SELECTING A LENDER |
|
|
| Exhibit H-25 |
RENTING HOME—YES OR NO |
|
|
| Exhibit H-26 |
OWNING OTHER PROPERTIES |
|
|
| Exhibit H-27 |
RENTING OUT OTHER PROPERTIES |
|
|
| Exhibit H-28 |
IMPROVEMENTS PLANNED IN NEXT THREE YEARS |
|
|
| Exhibit H-29 |
OWNERSHIP TIME FRAME VS. LIKELIHOOD TO SELL |
|
|
| Exhibit H-30 |
IN CONTACT WITH AGENT—YES OR NO |
|
|
| Exhibit H-31 |
AGENT RECOMMENDATION |
|
|
Notes
iCody Fuller, “The Evolving First-Time Homebuyer,” Zillow Research (November 10, 2015).
iiU.S. Census Bureau, Current Population Survey, 2015.
iiiZillow analysis of the U.S. Census Bureau and the Department of Housing and Urban Development on new home sales and the National Association of Realtors® on existing home sales, seasonally adjusted annual rates, August 2016.
ivCody Fuller, “The Evolving First-Time Homebuyer,” Zillow Research (November 10, 2015).
Copyright © 2016 by Zillow Group, Inc. and/or its affiliates. All rights reserved. No part of this publication may be reproduced, distributed, or transmitted in any form or by any means without the prior written permission of Zillow Group, Inc.

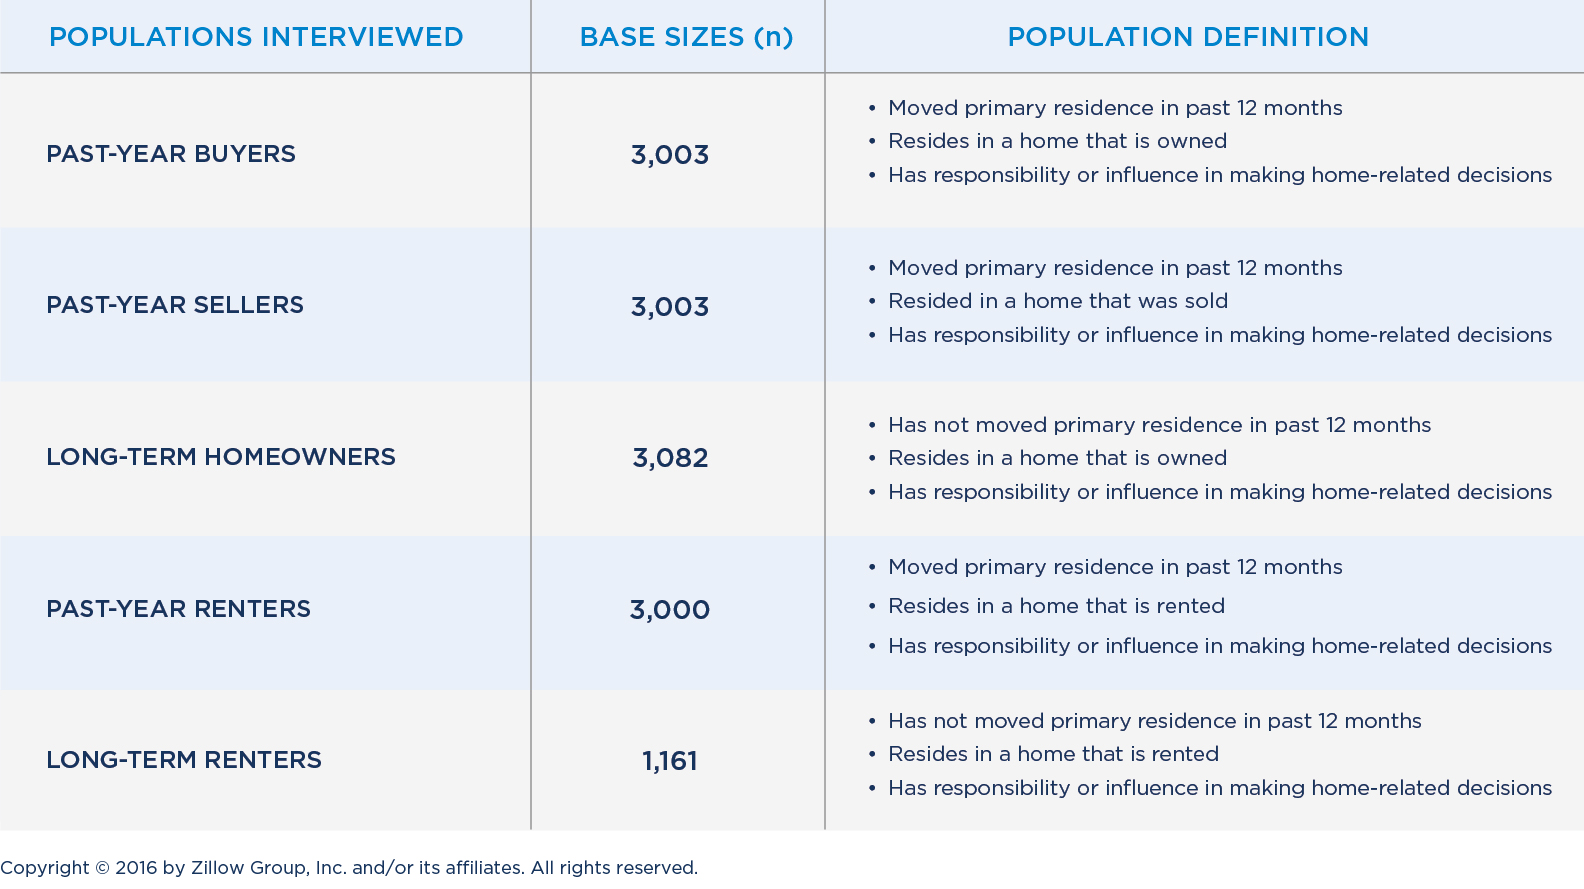
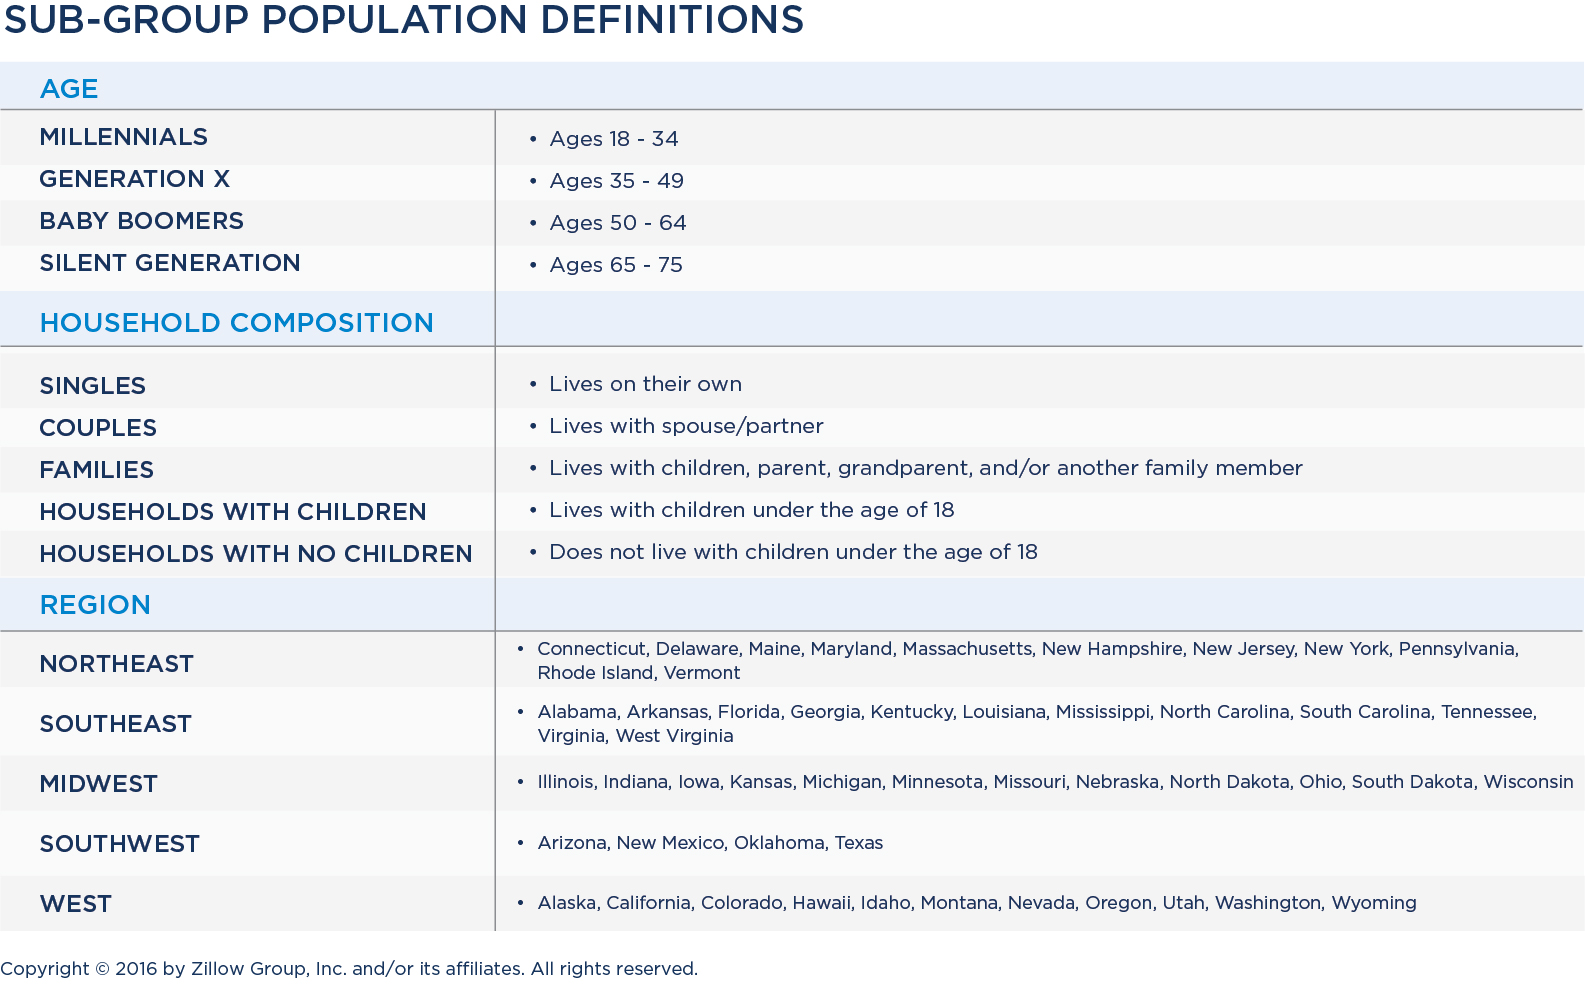
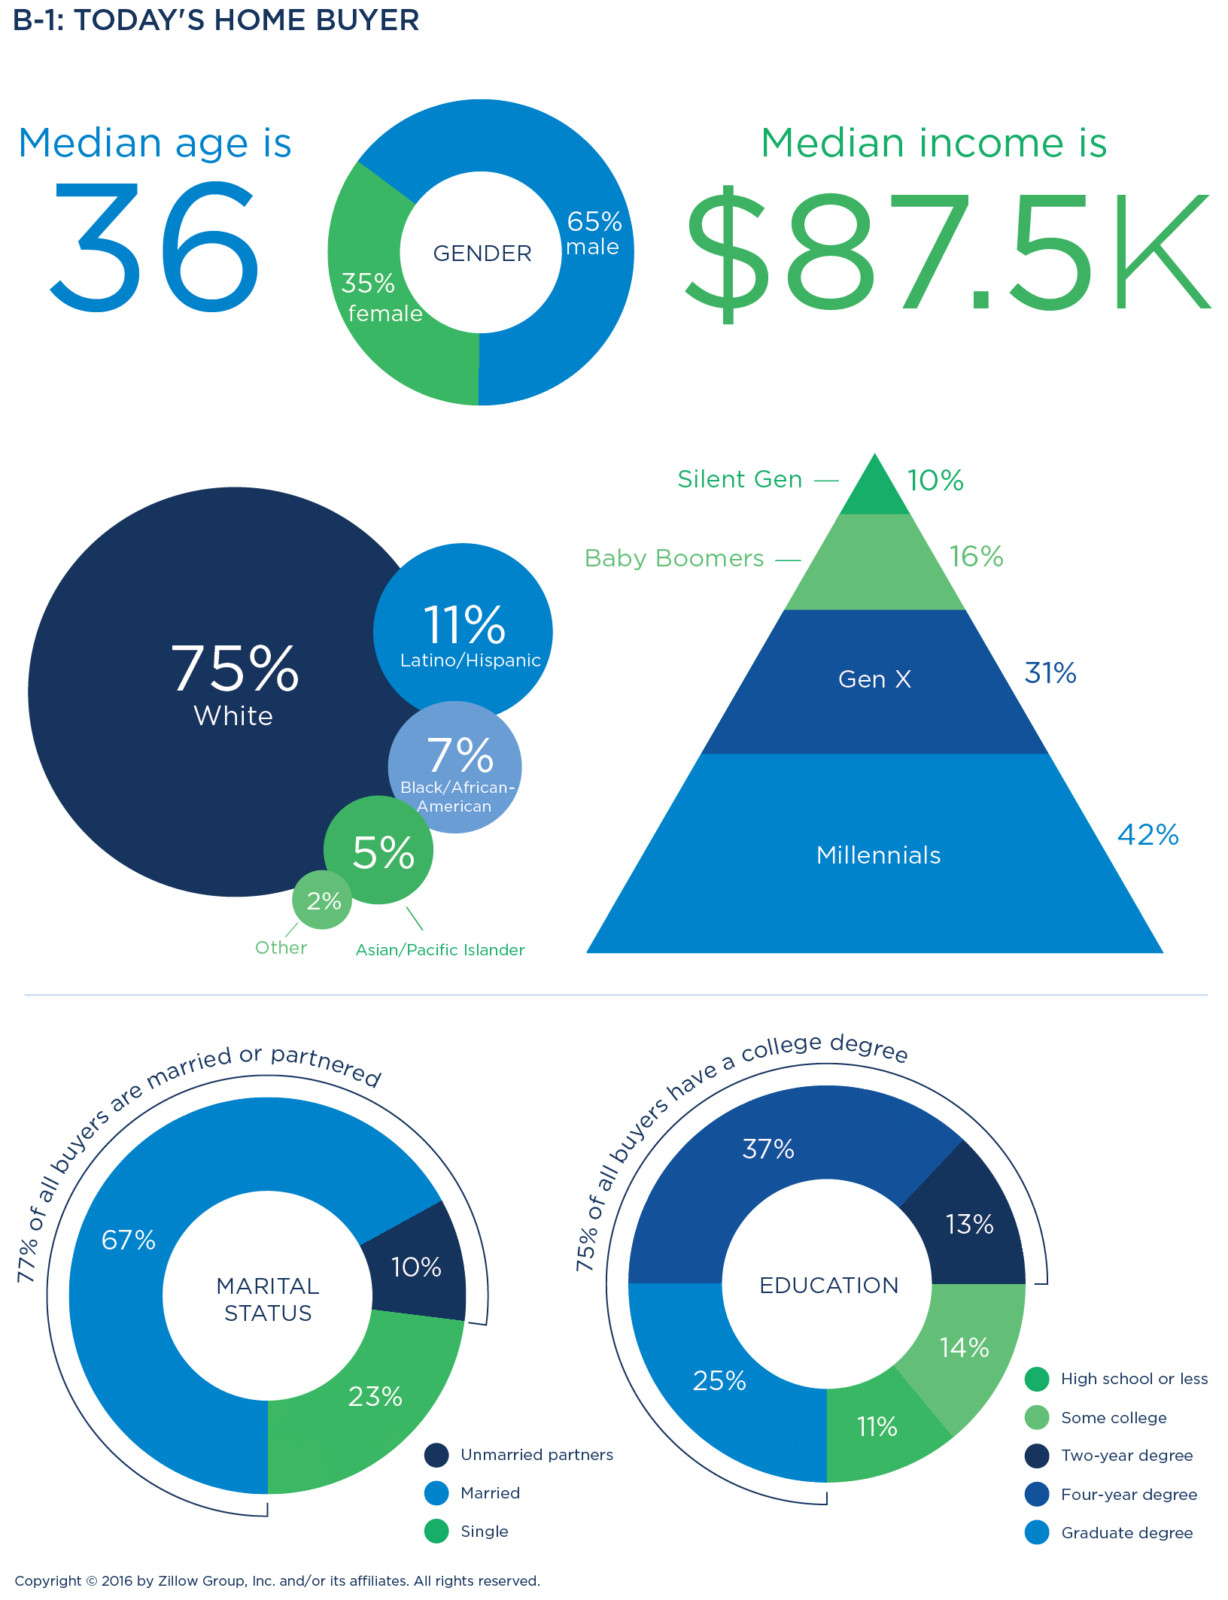
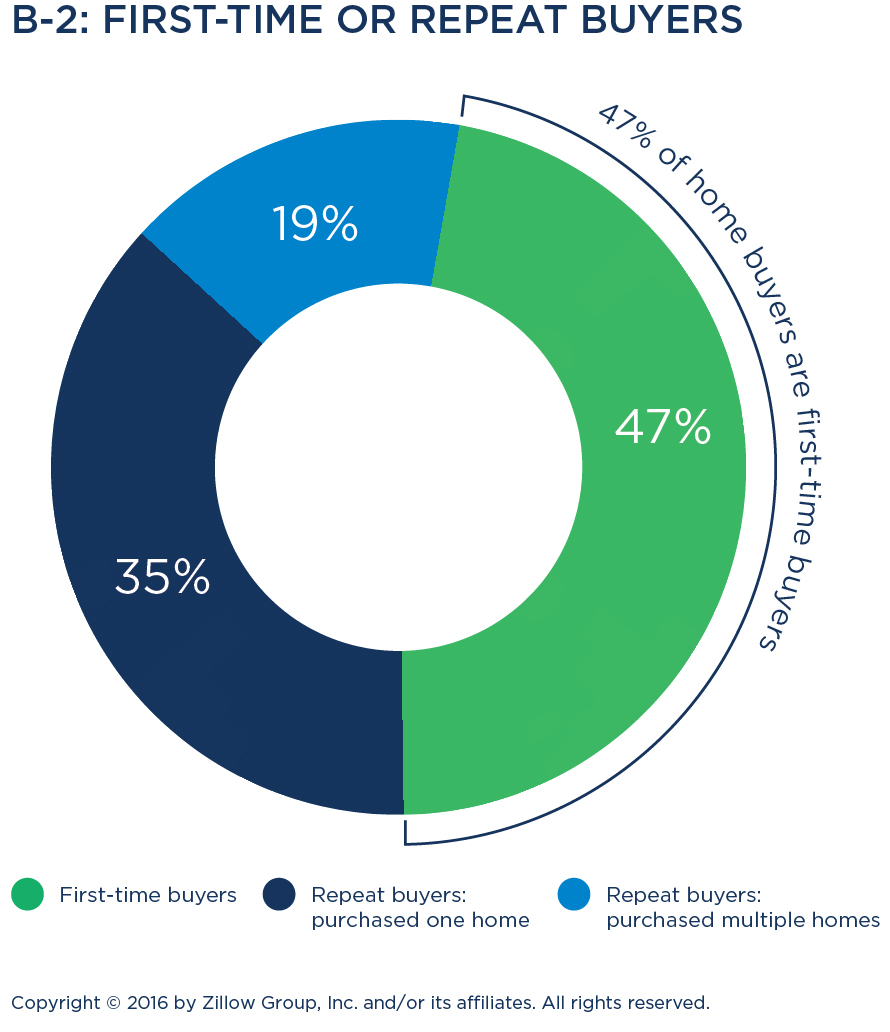
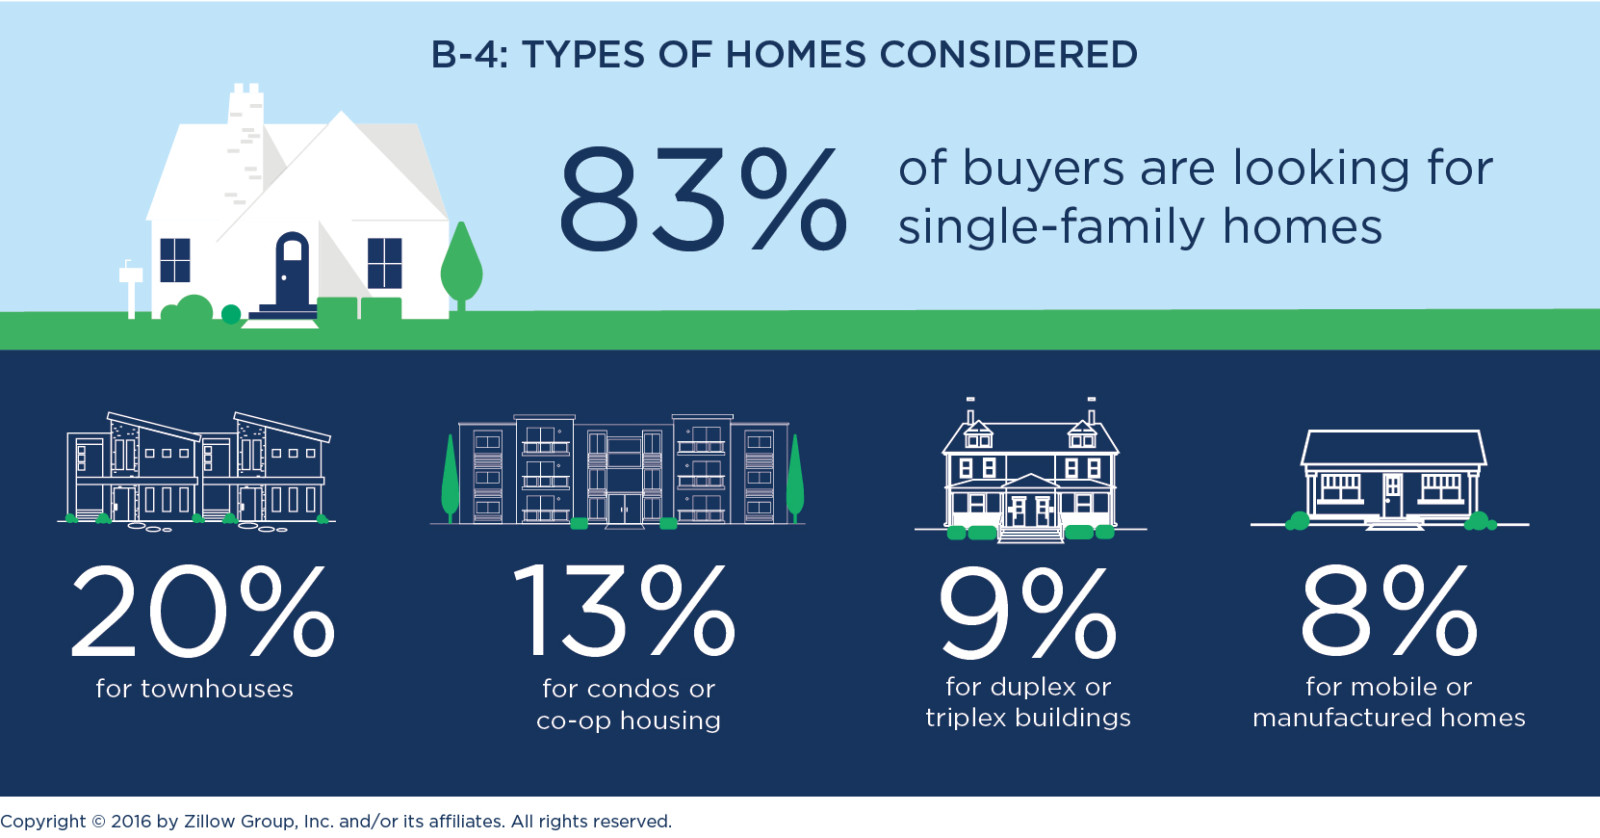
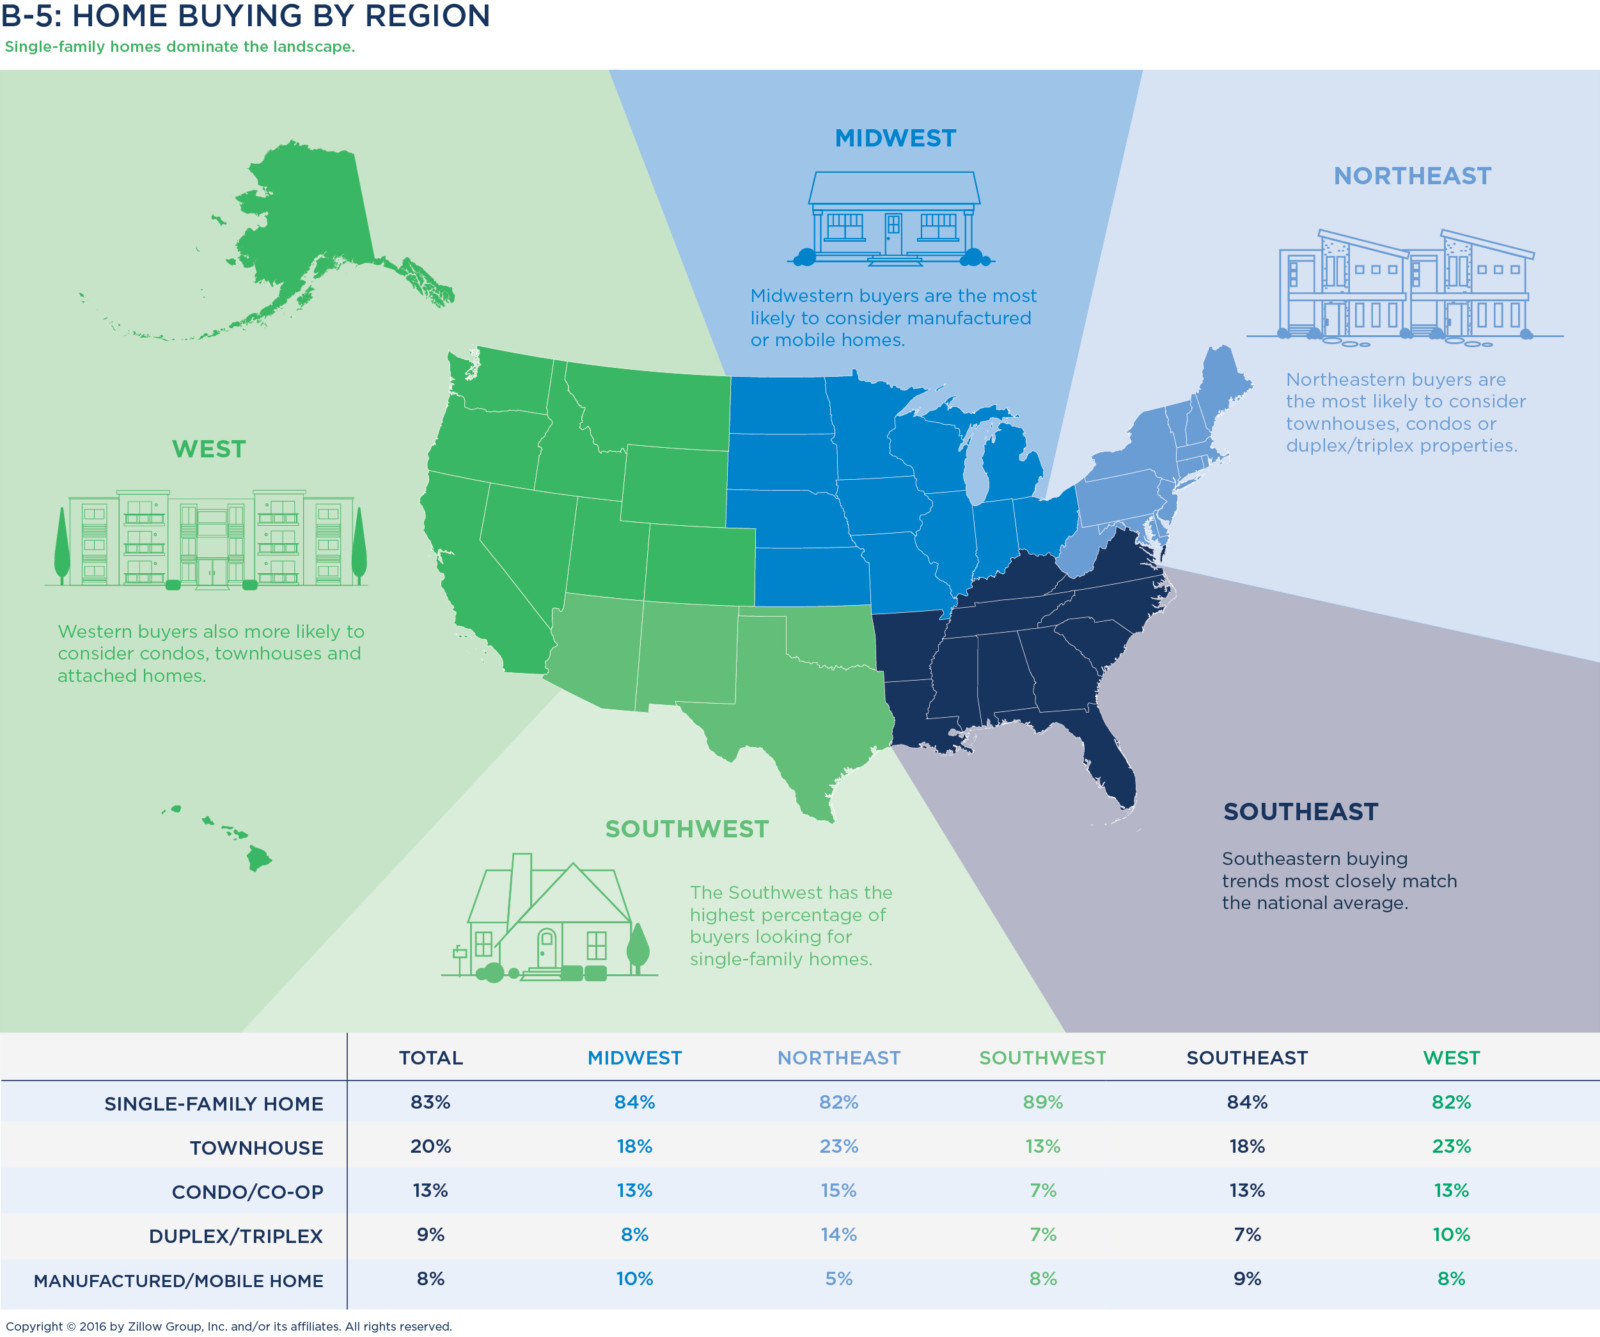

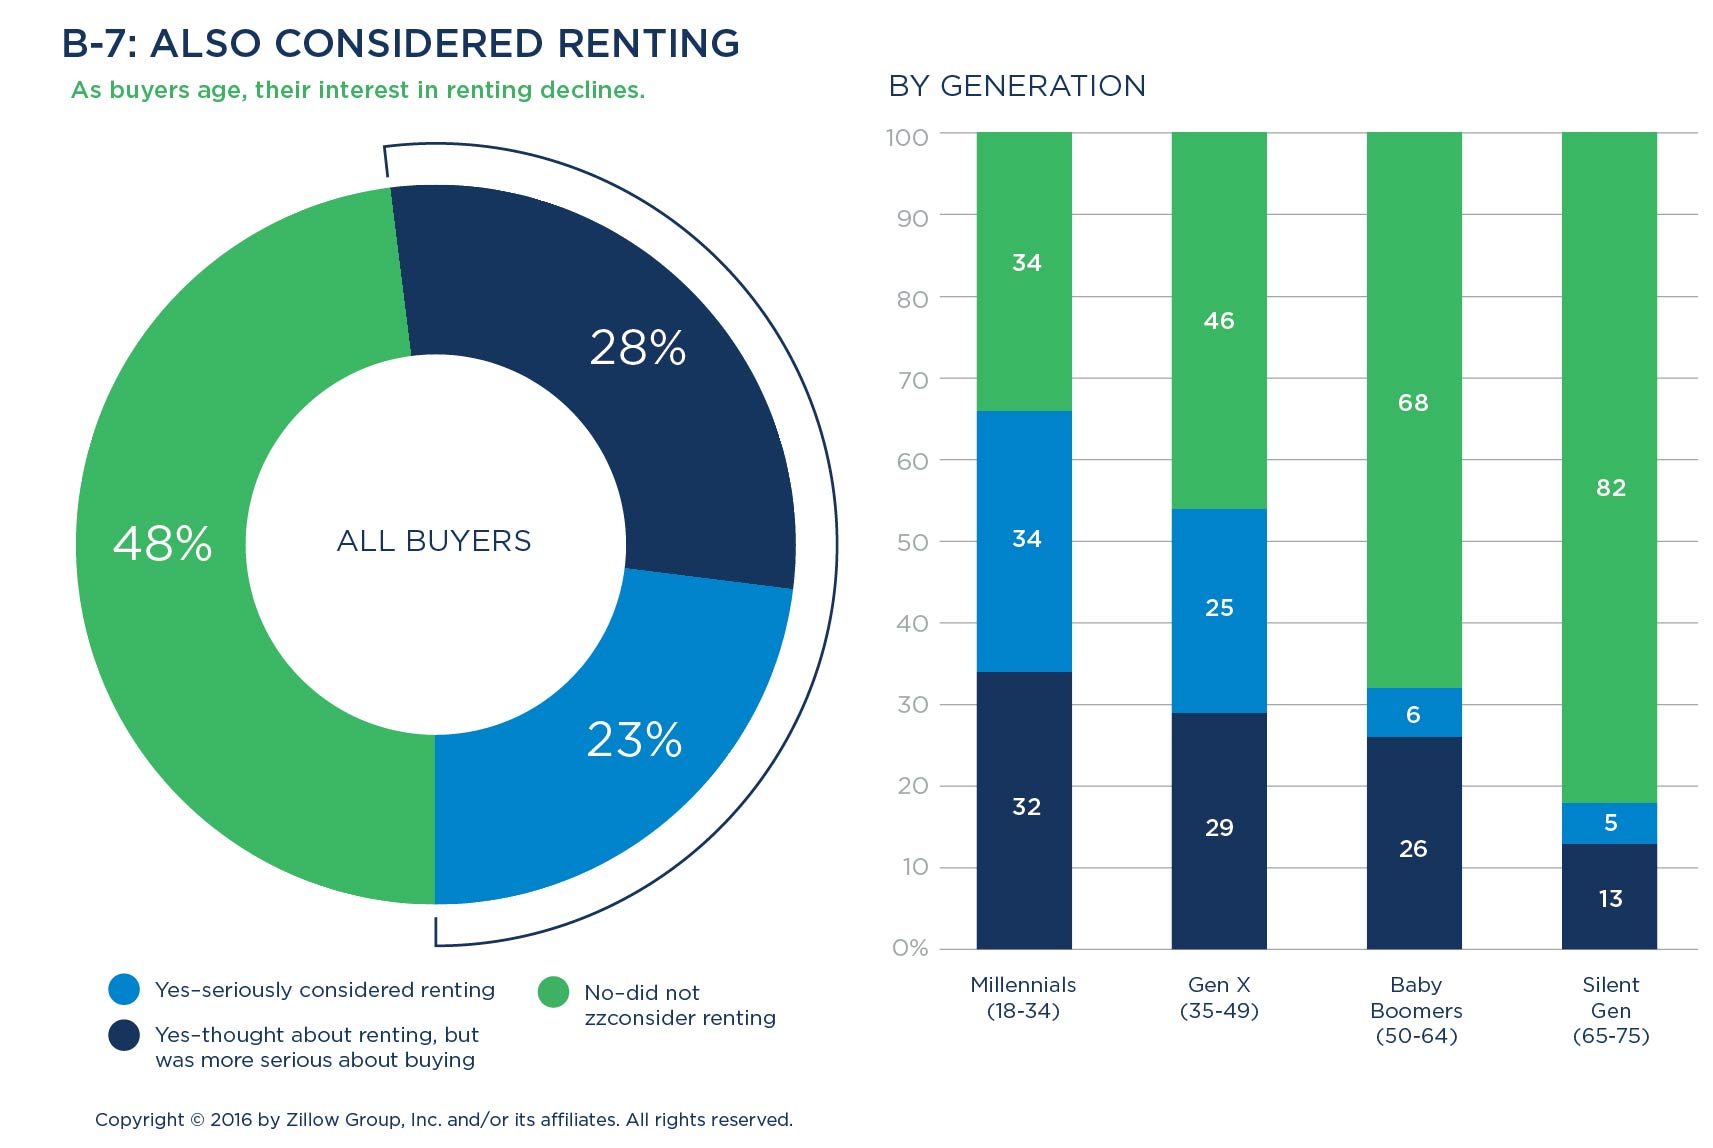

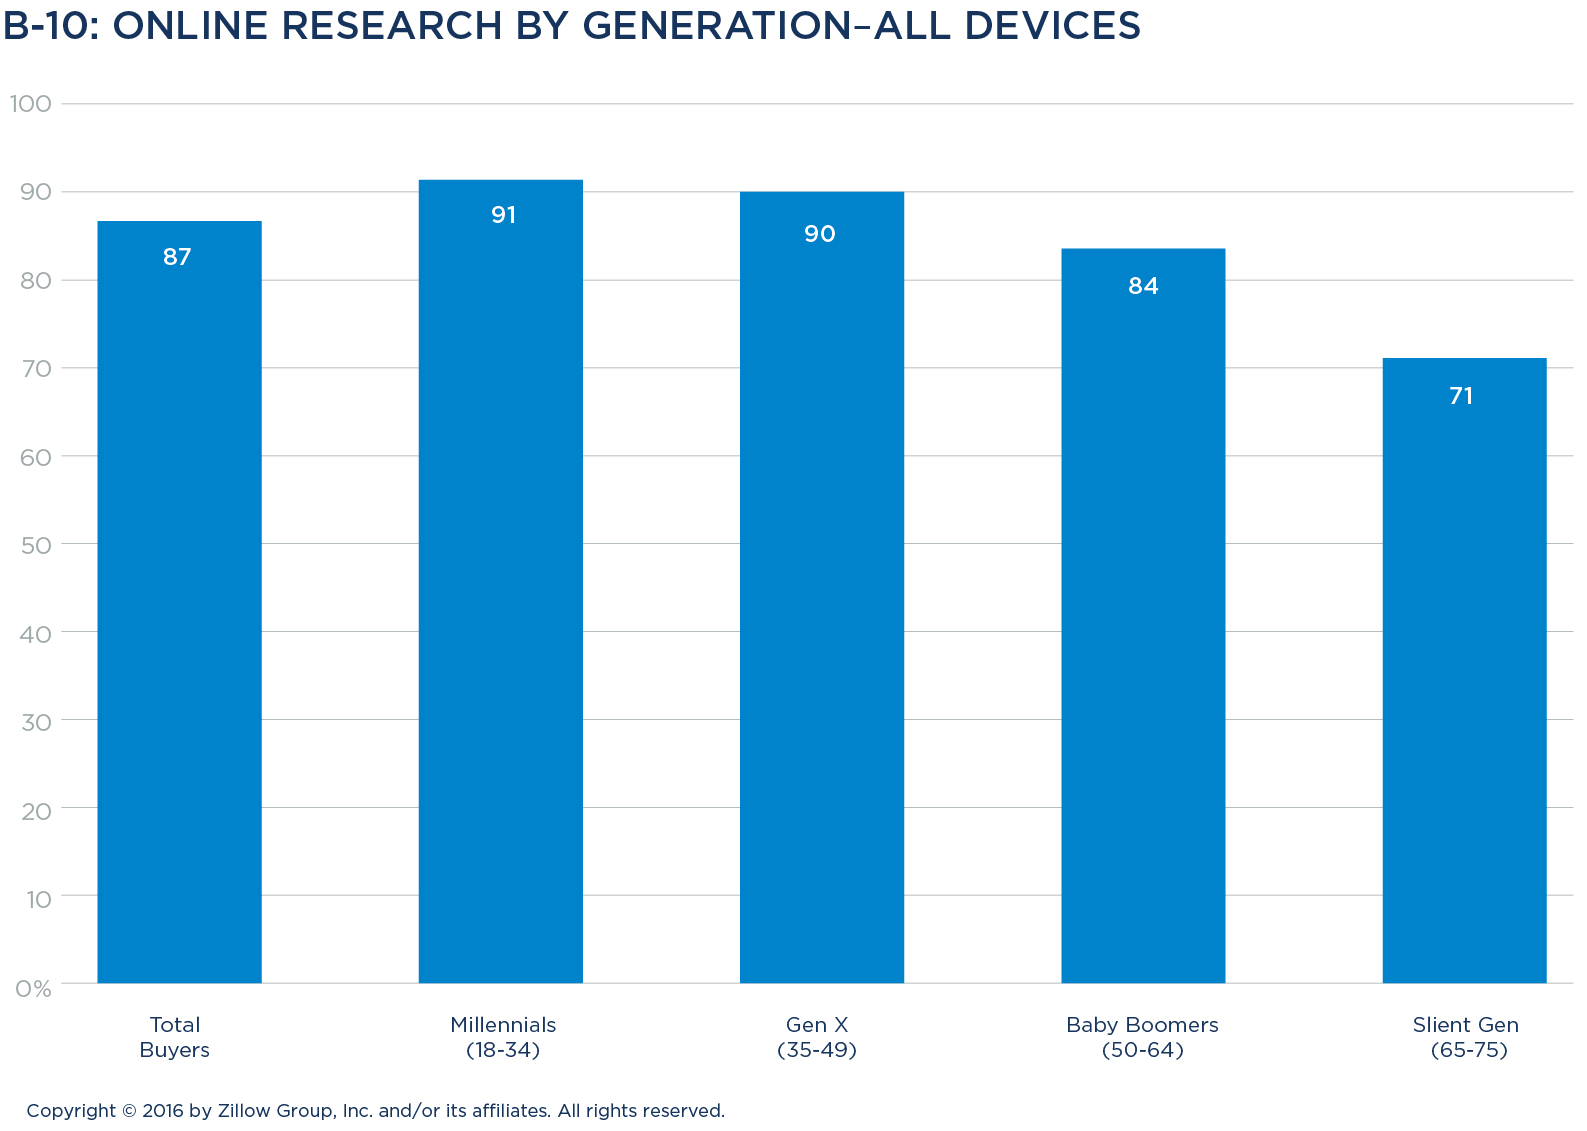
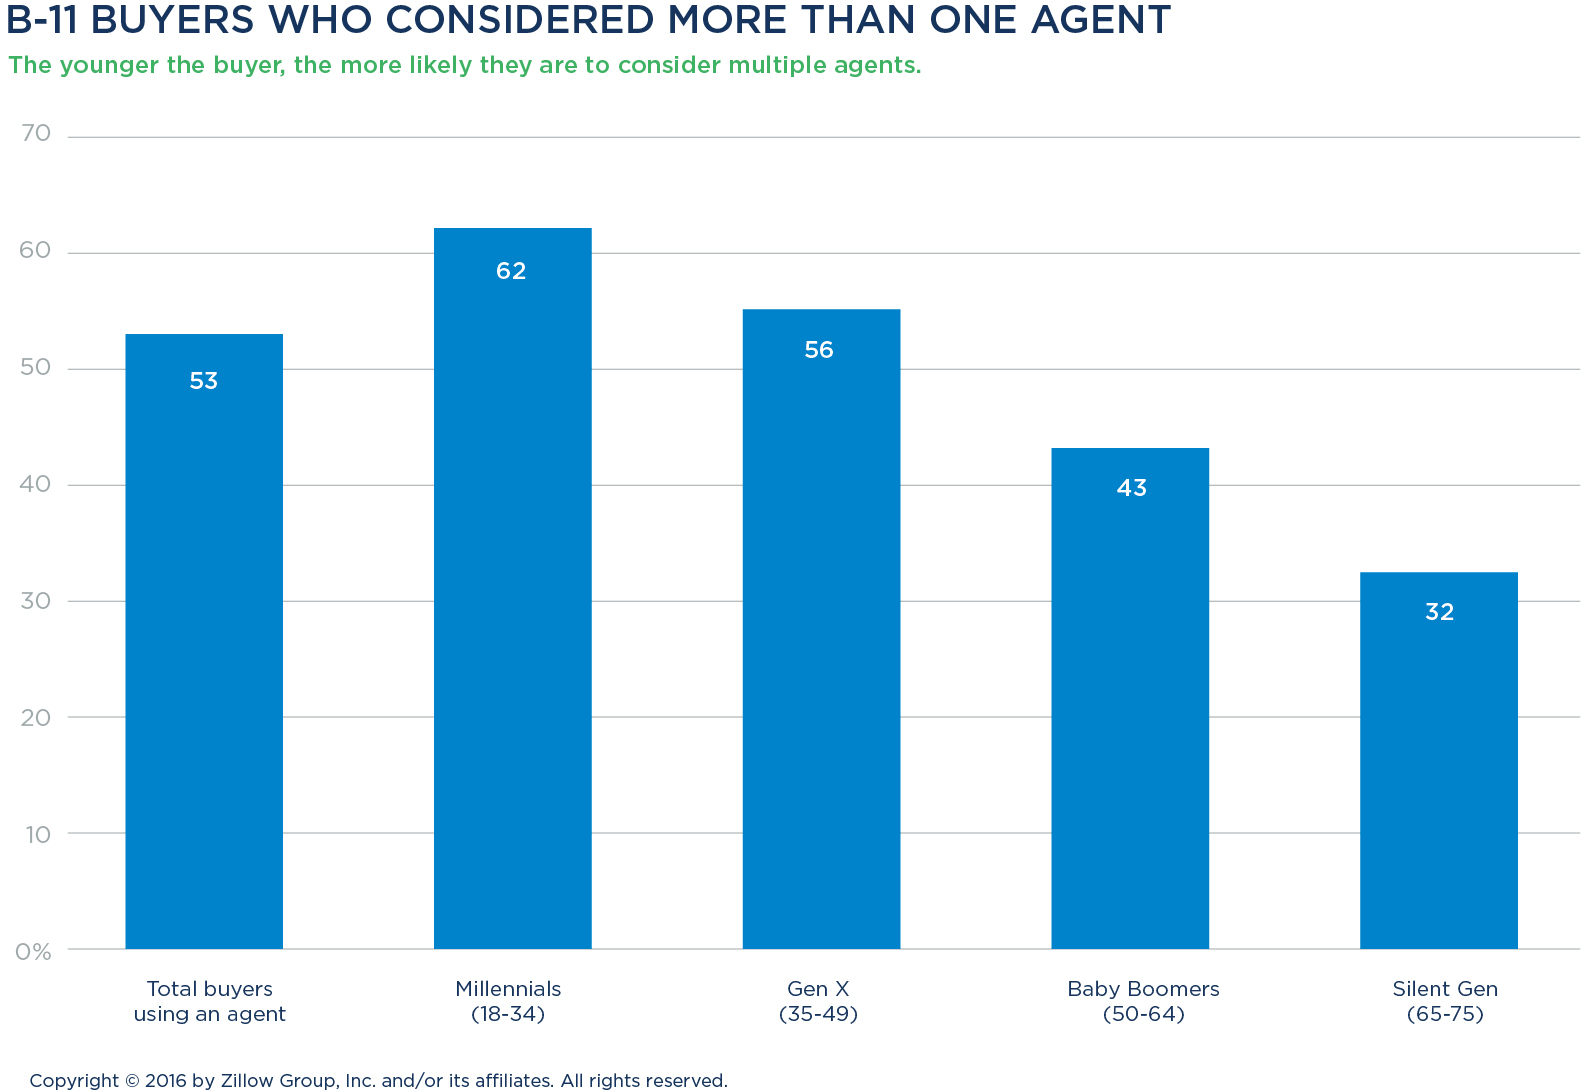


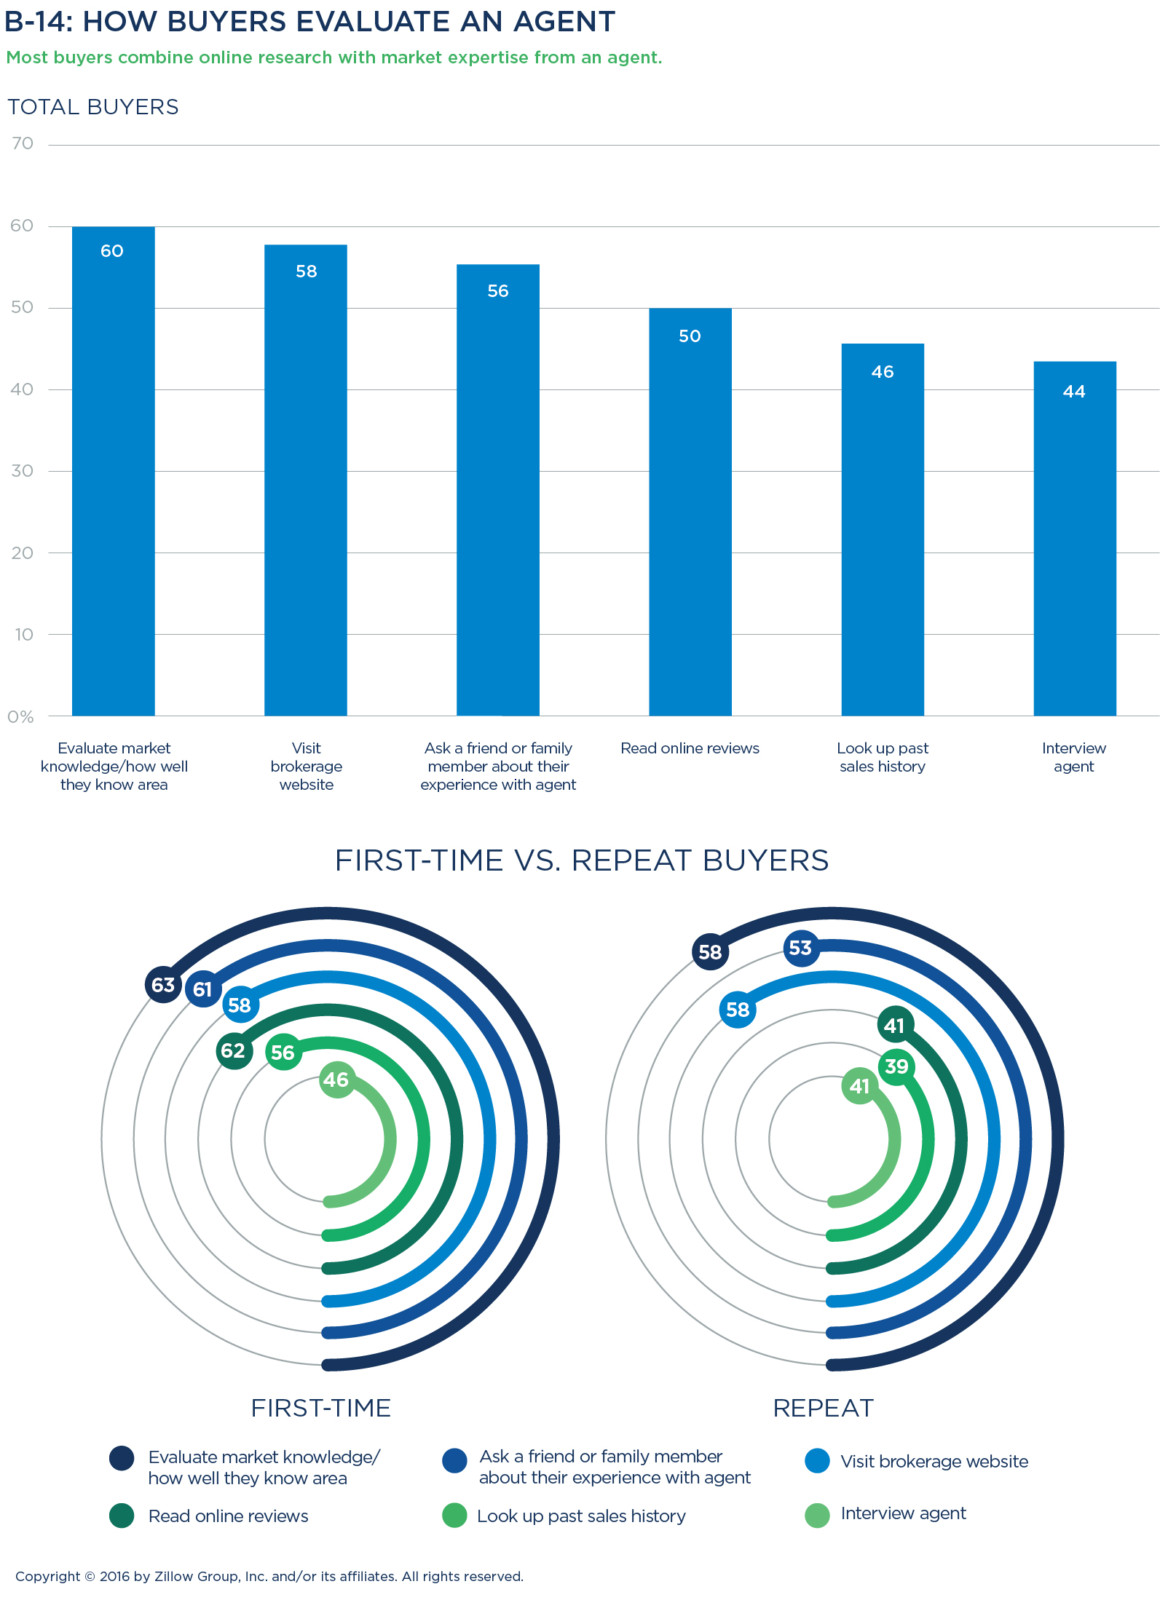

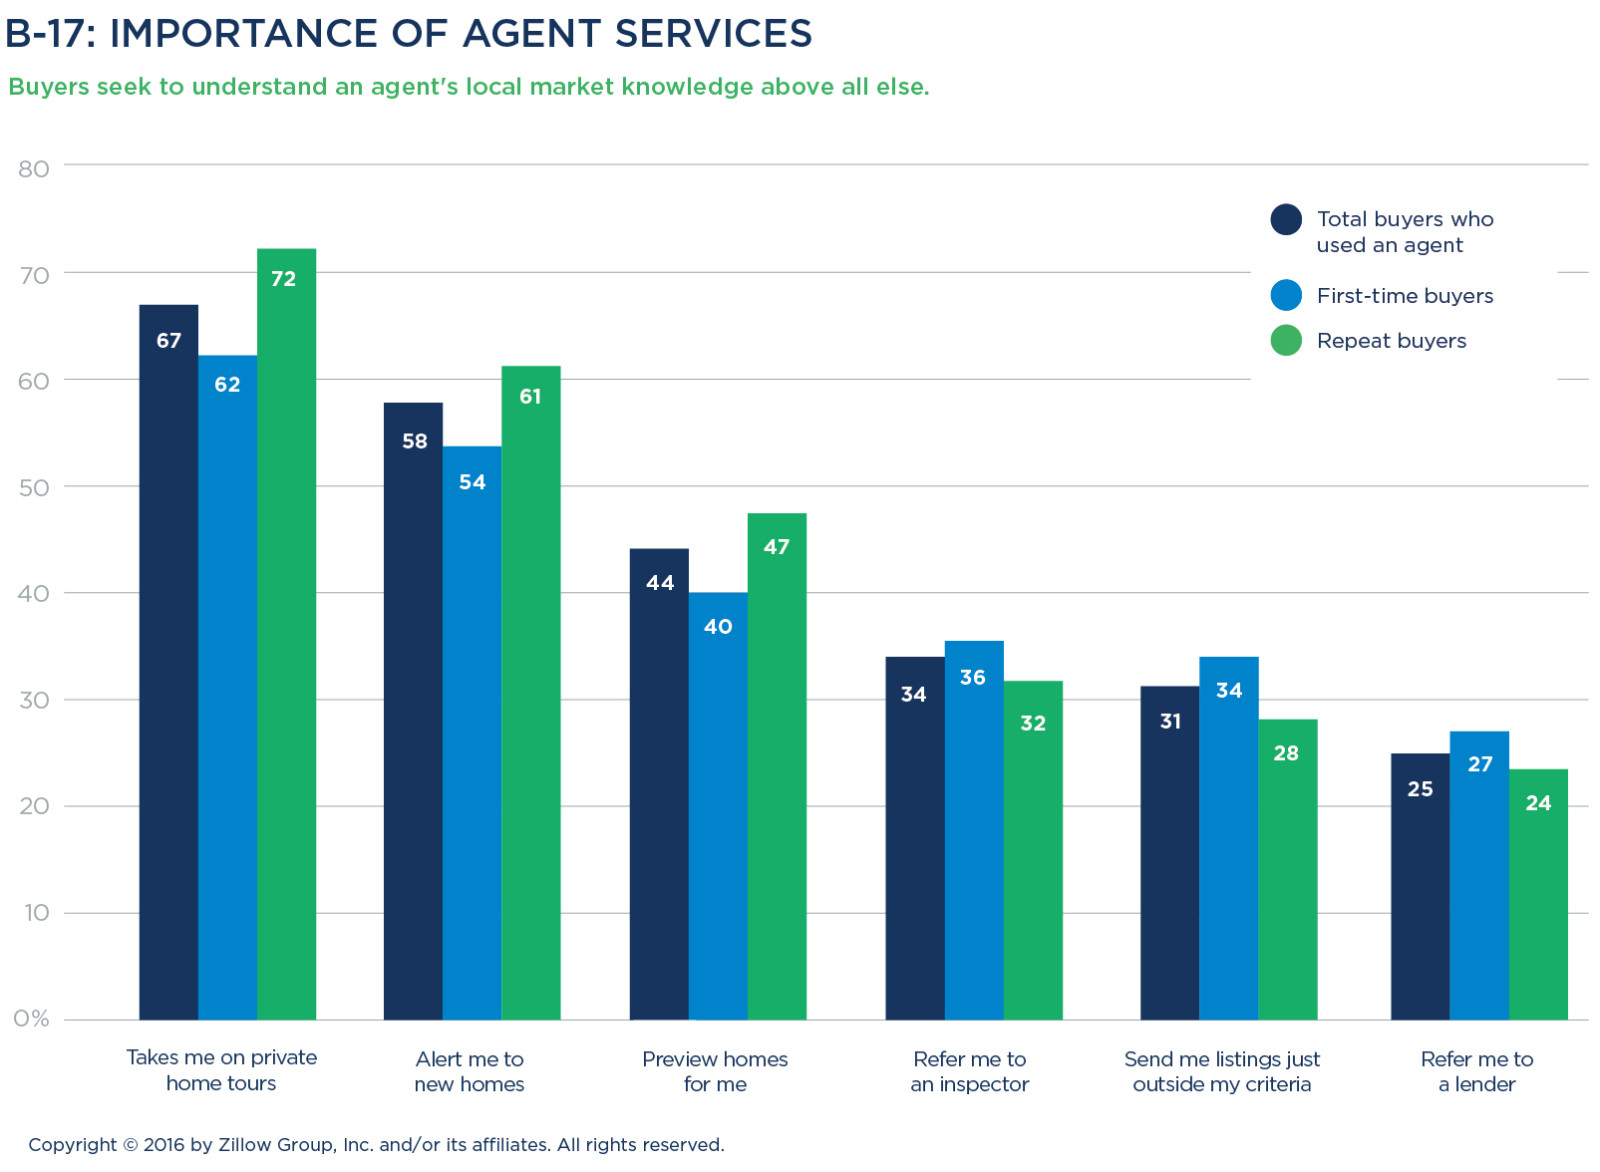
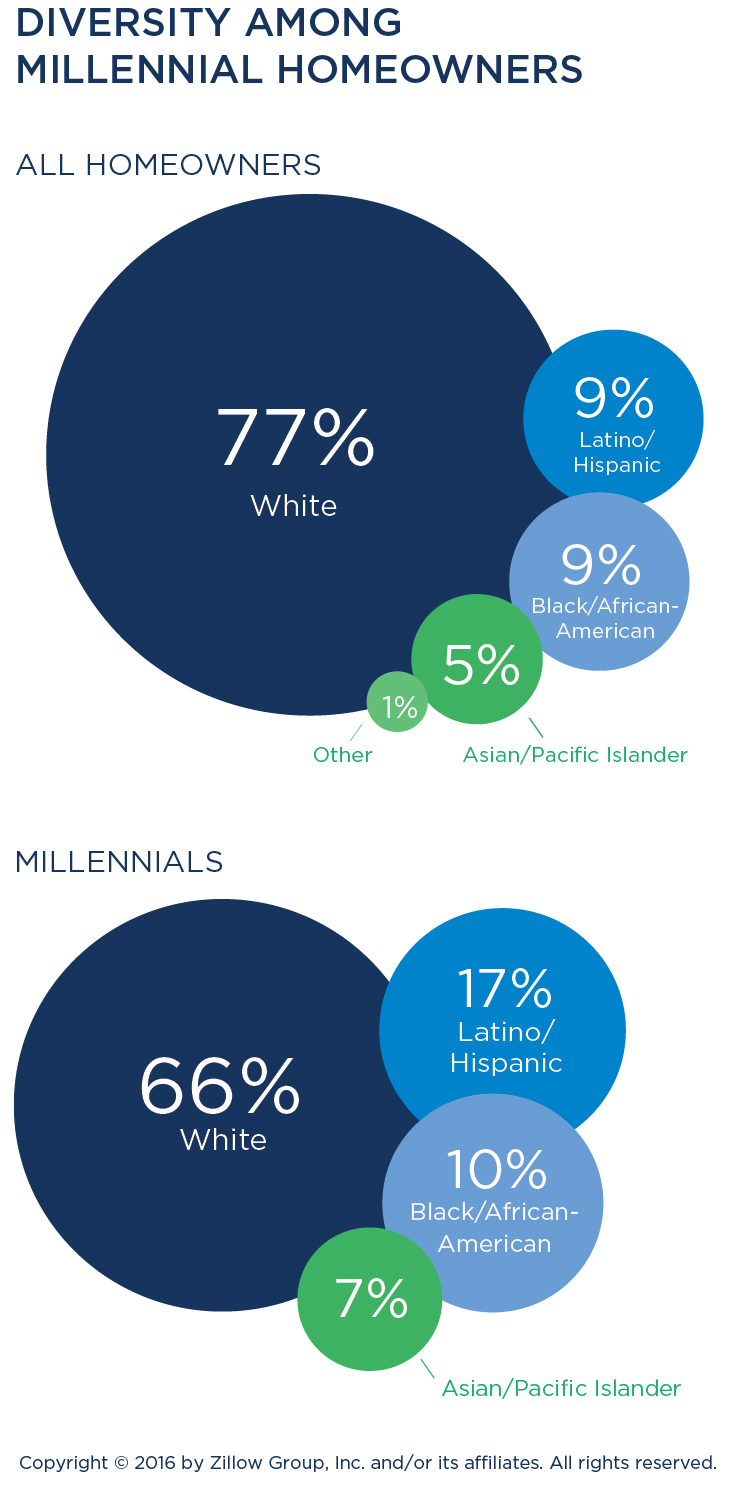

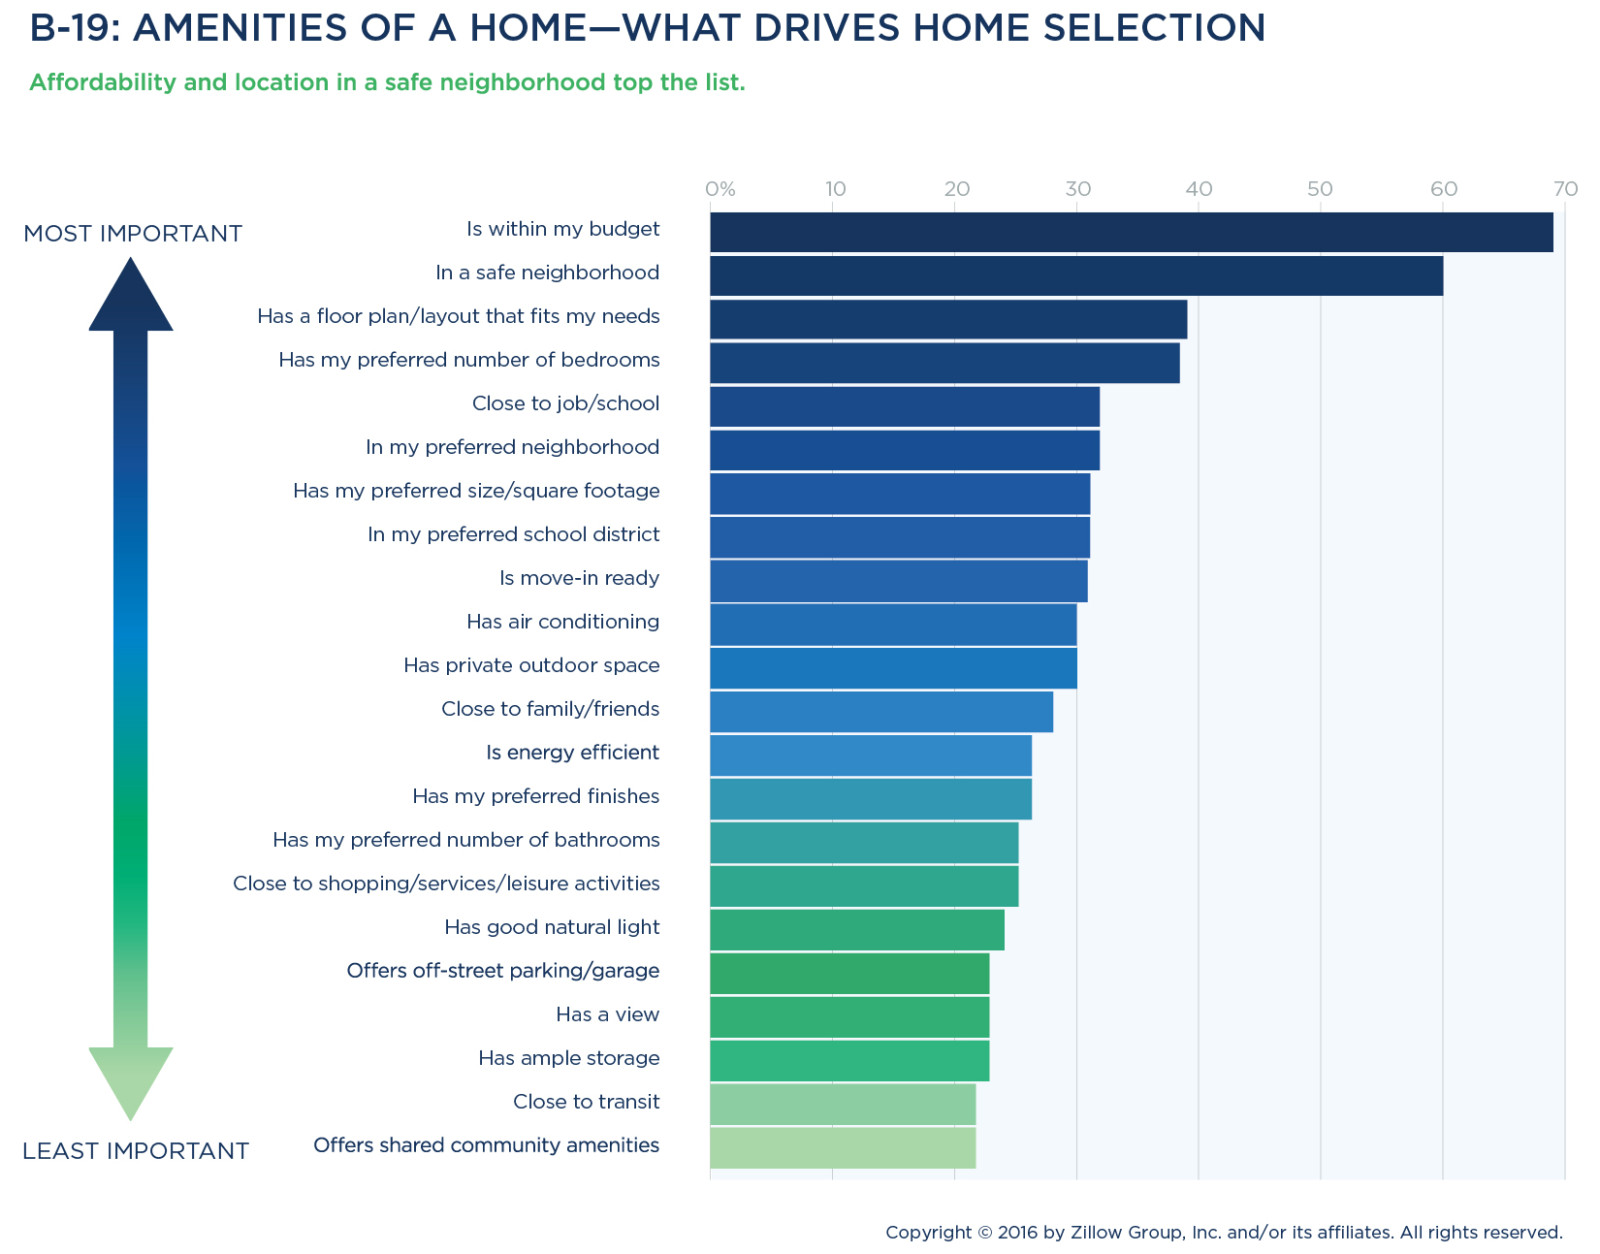

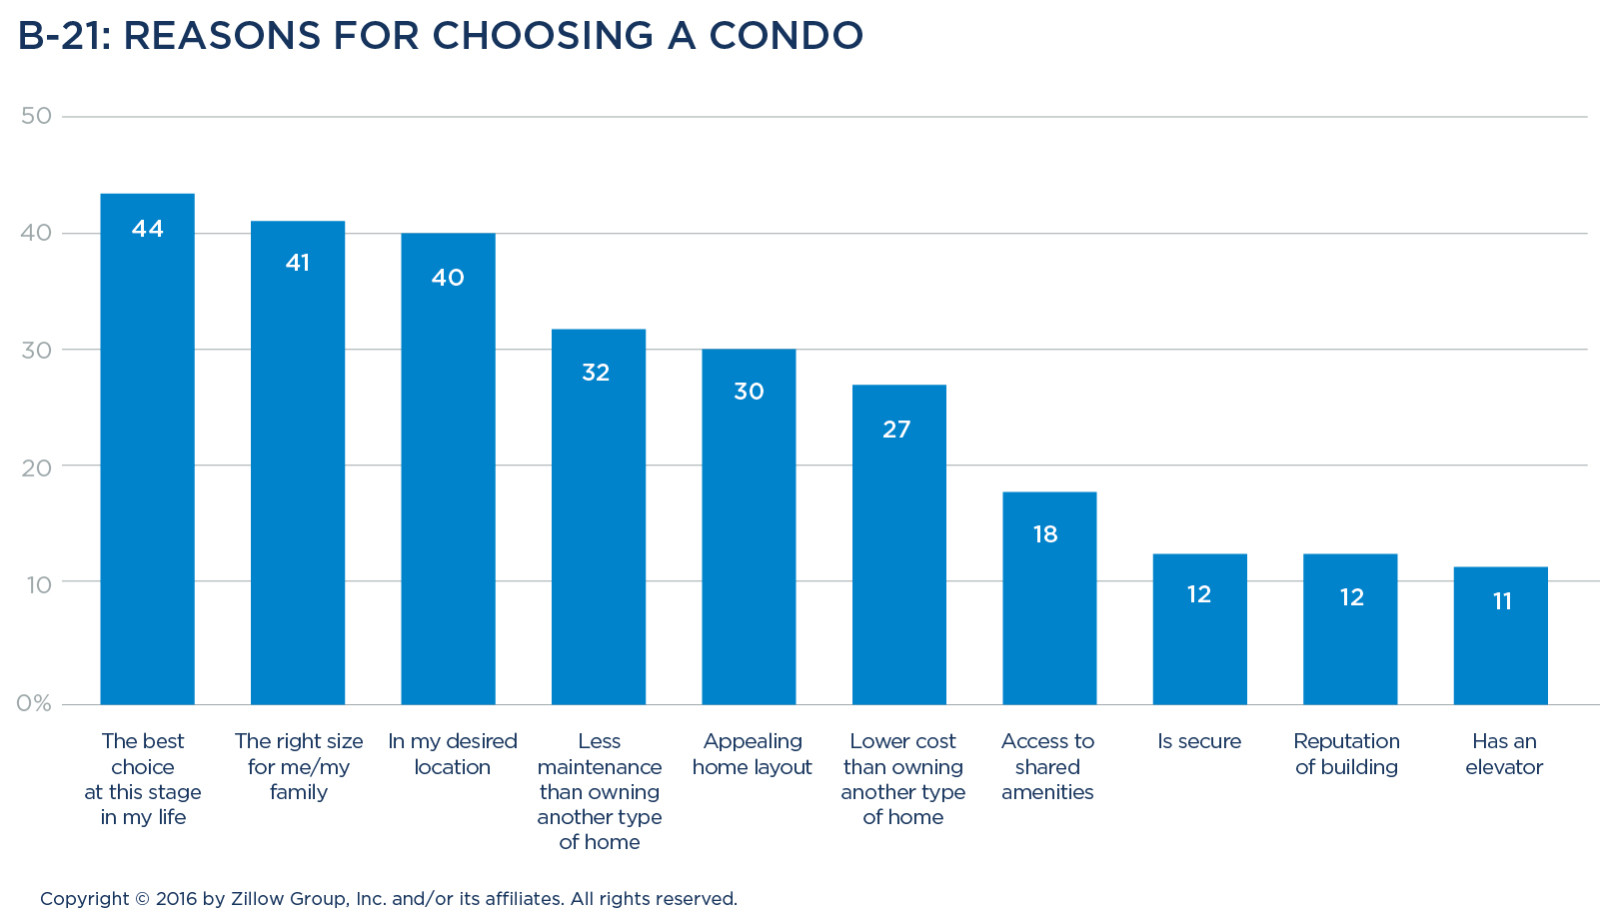
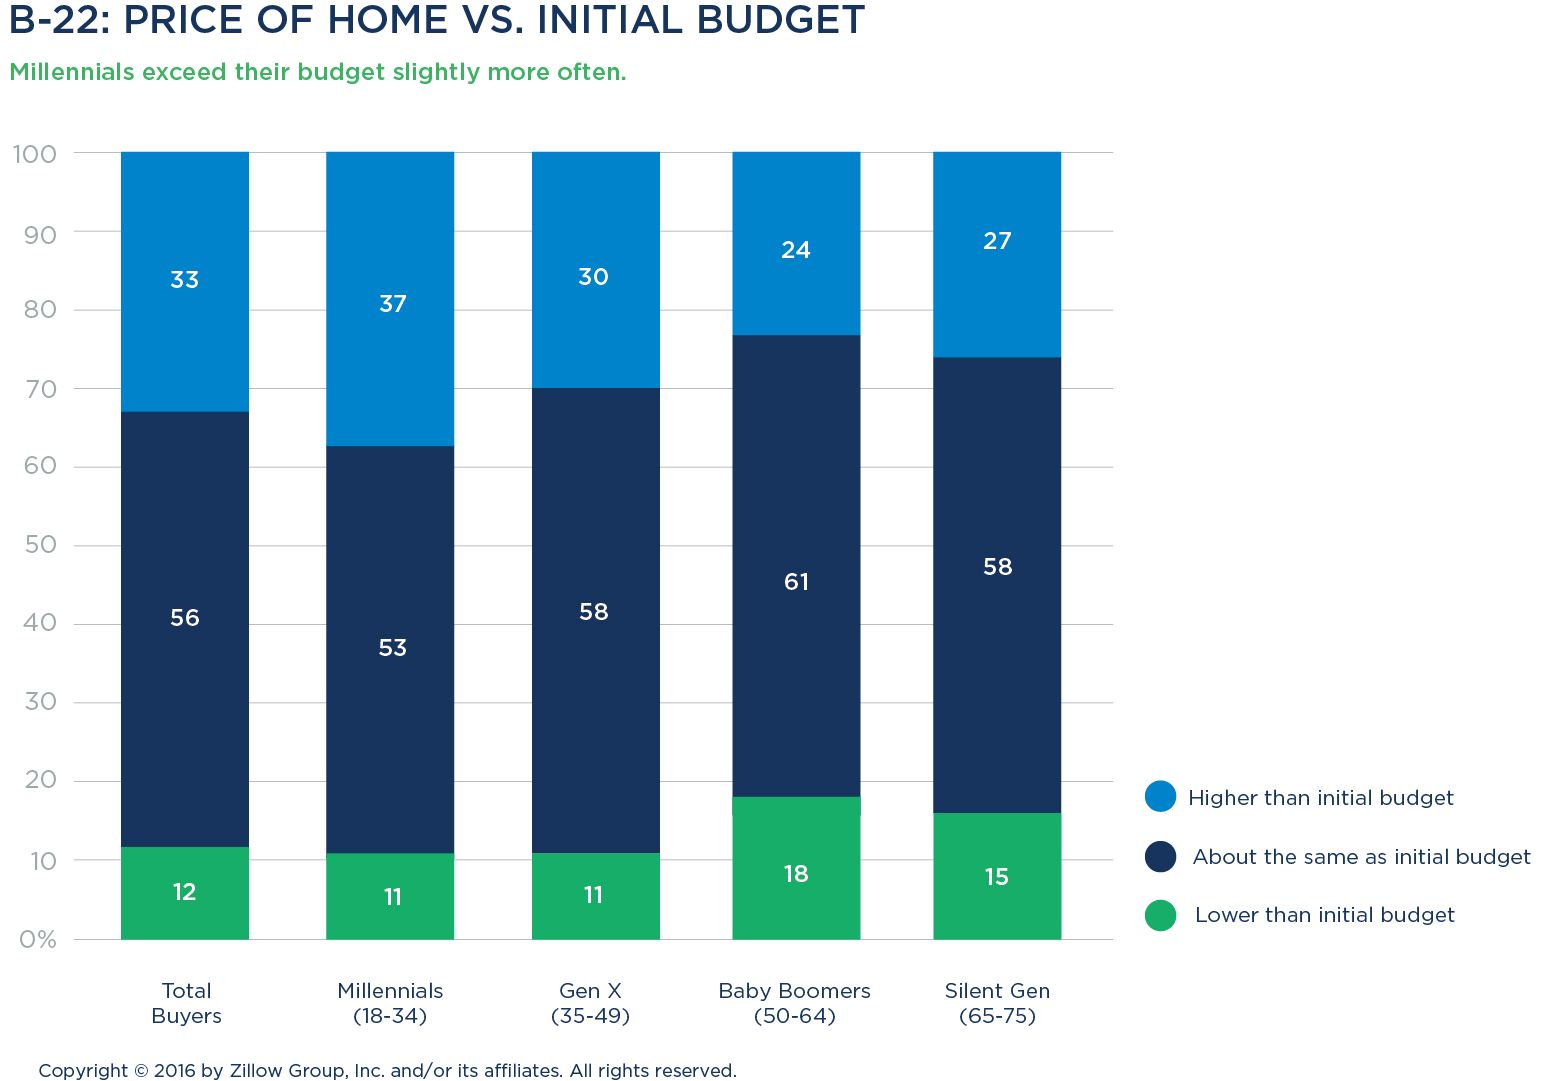
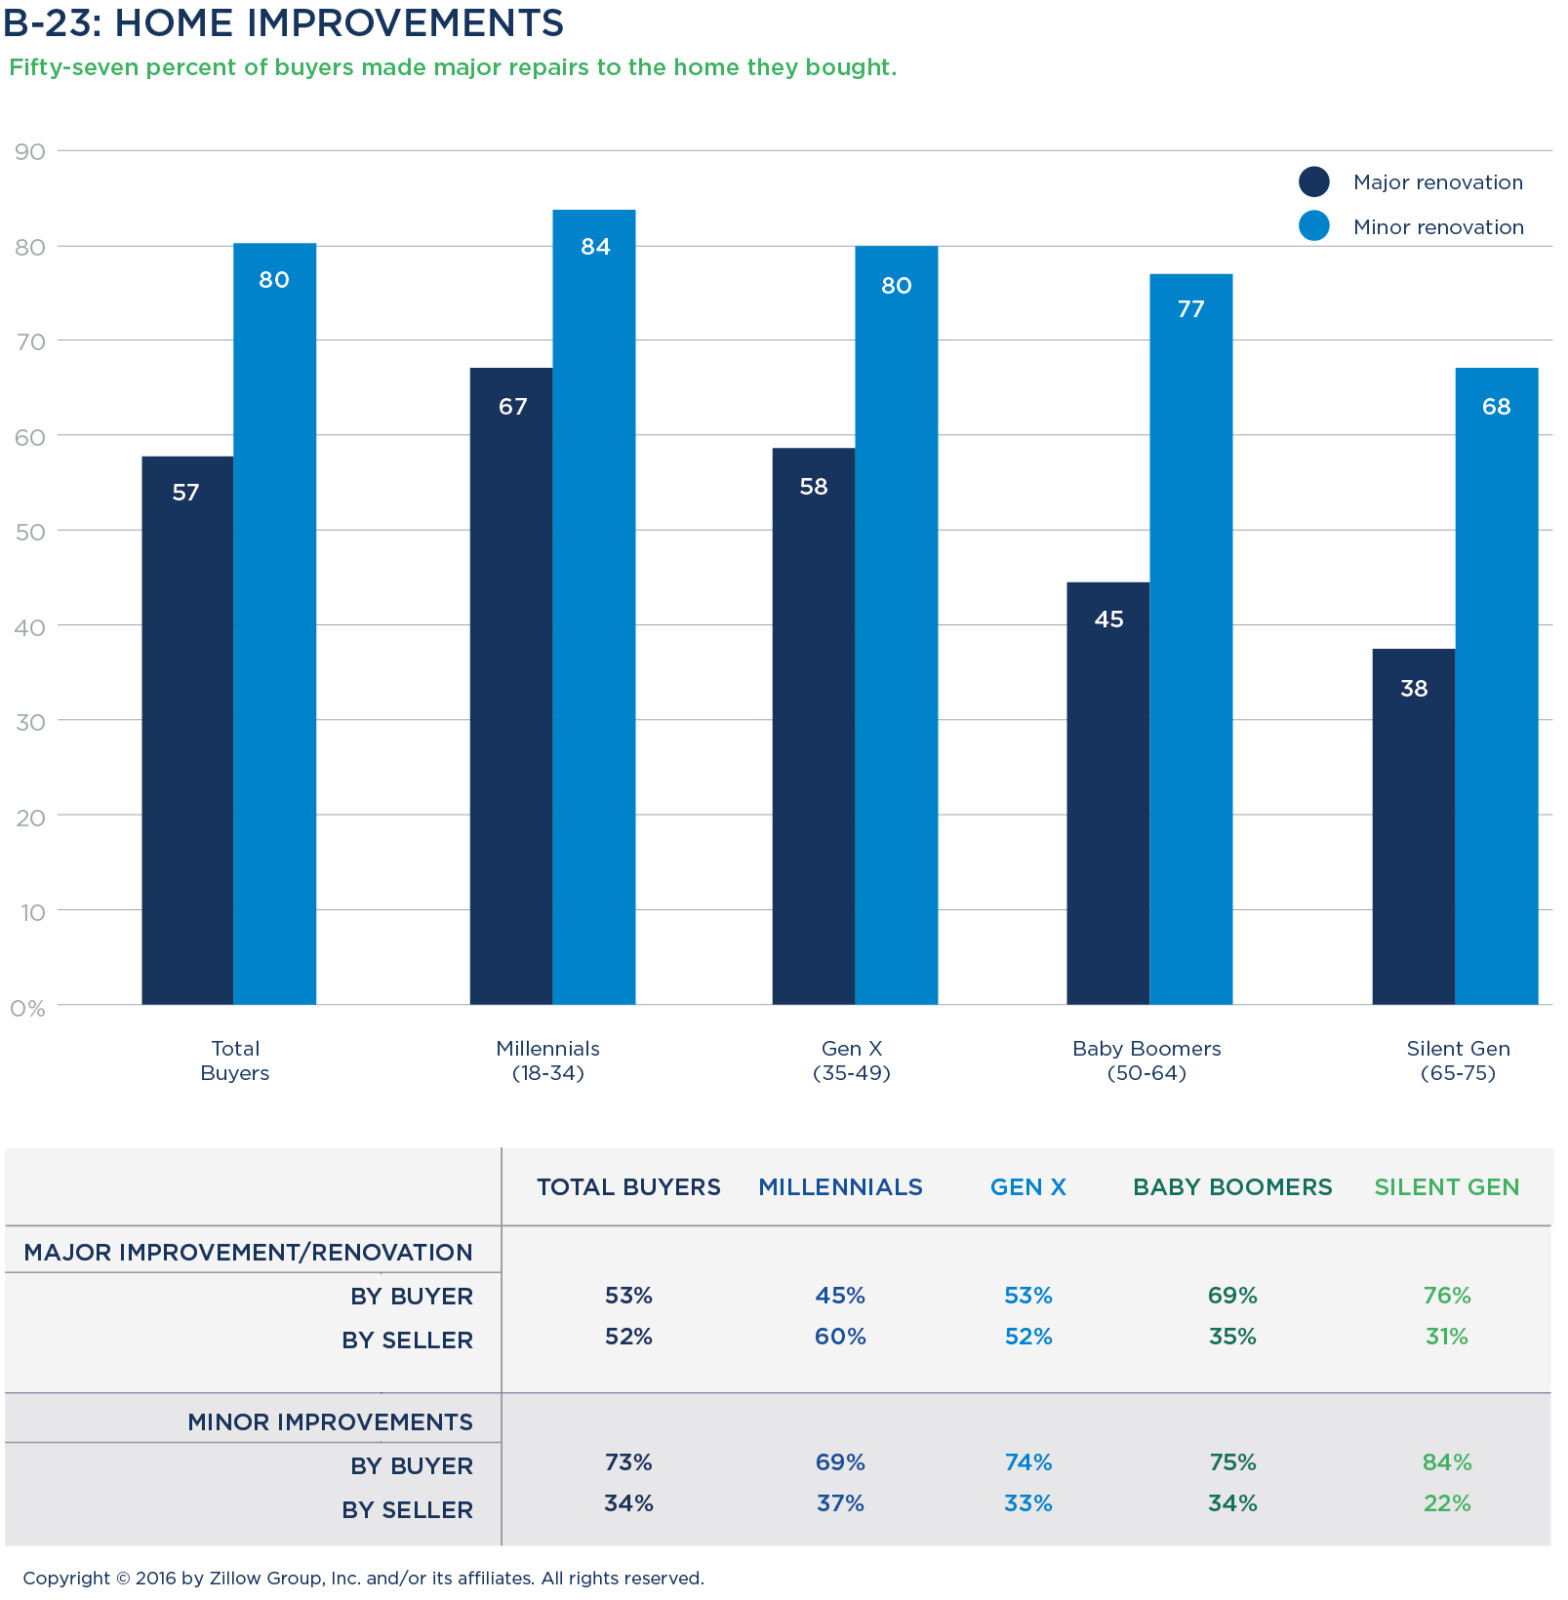
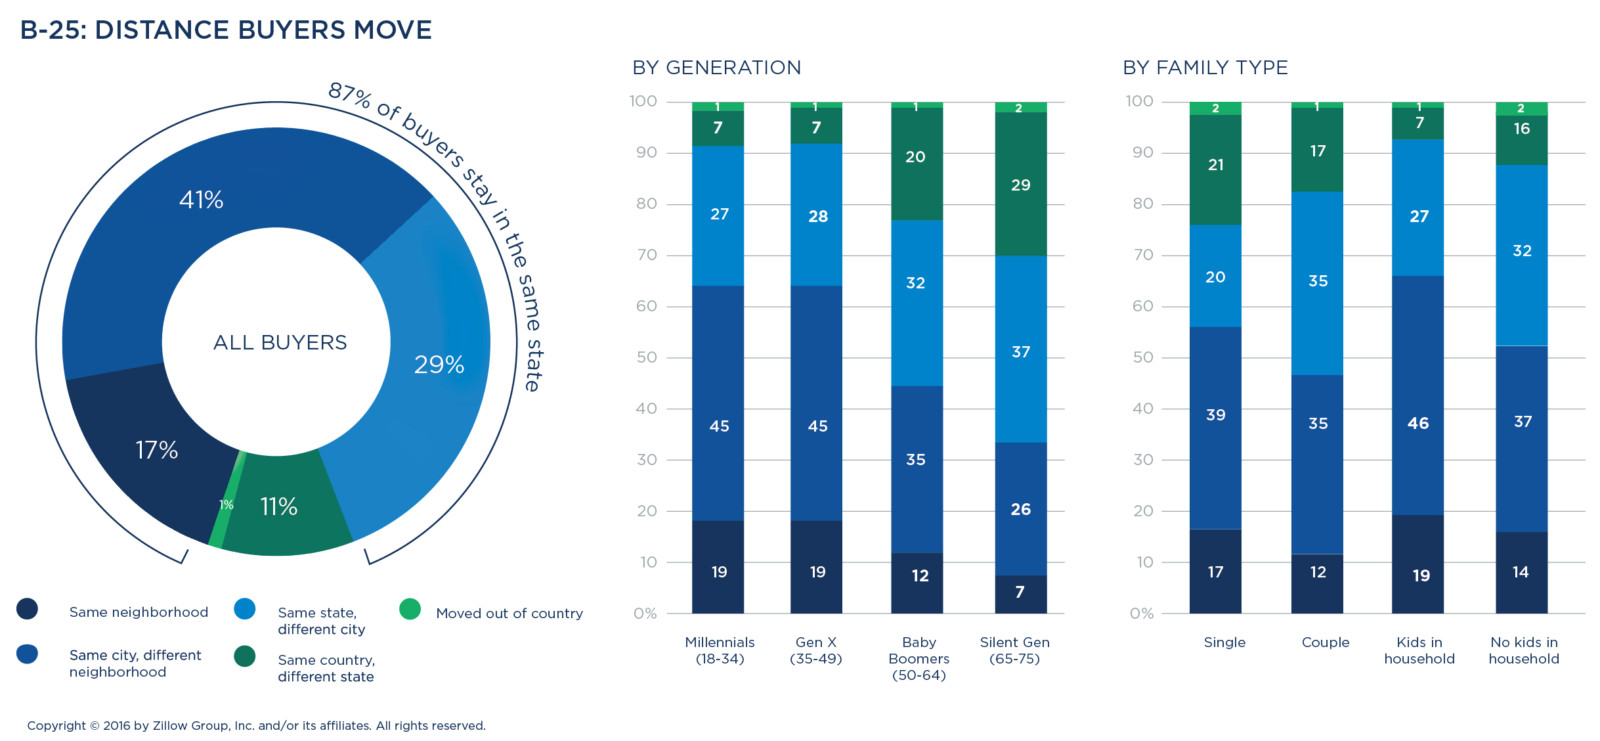


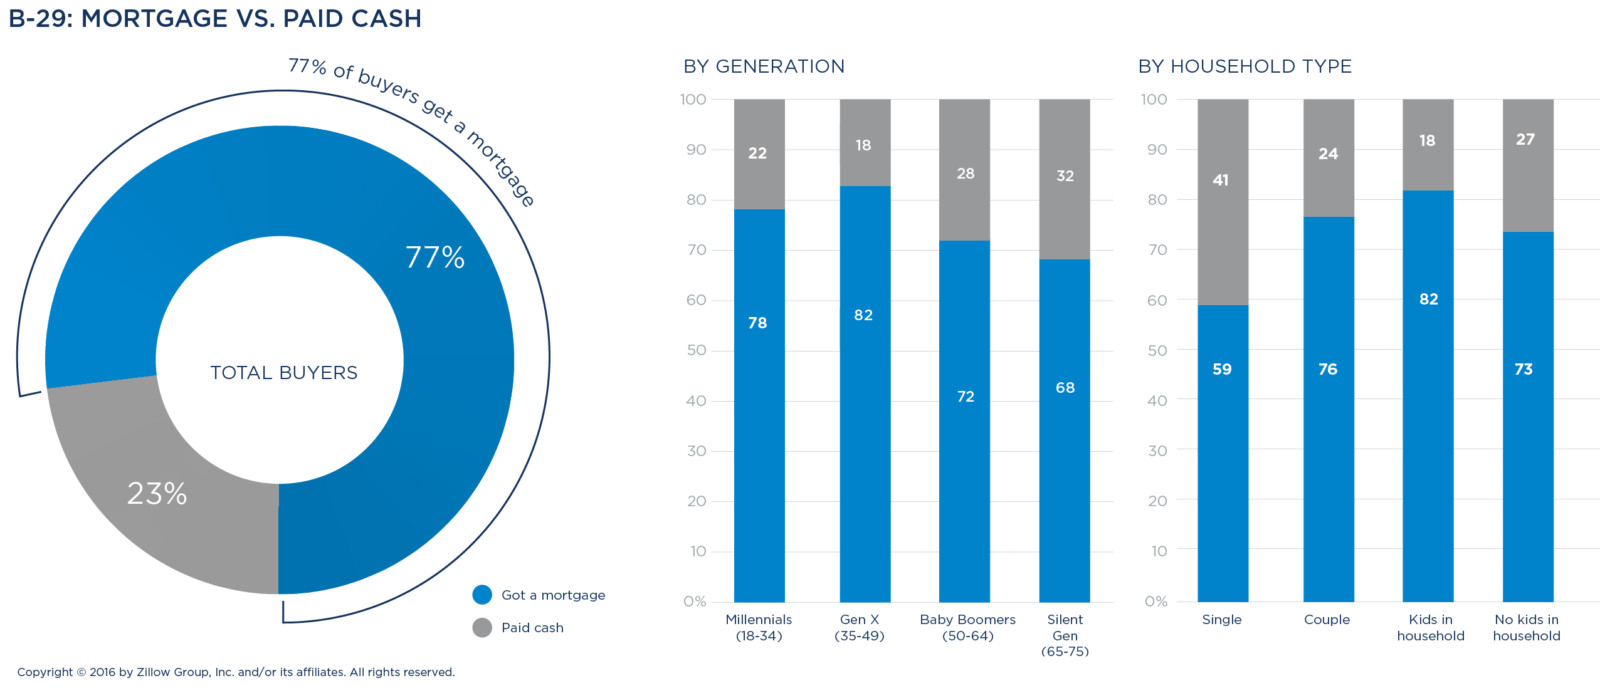

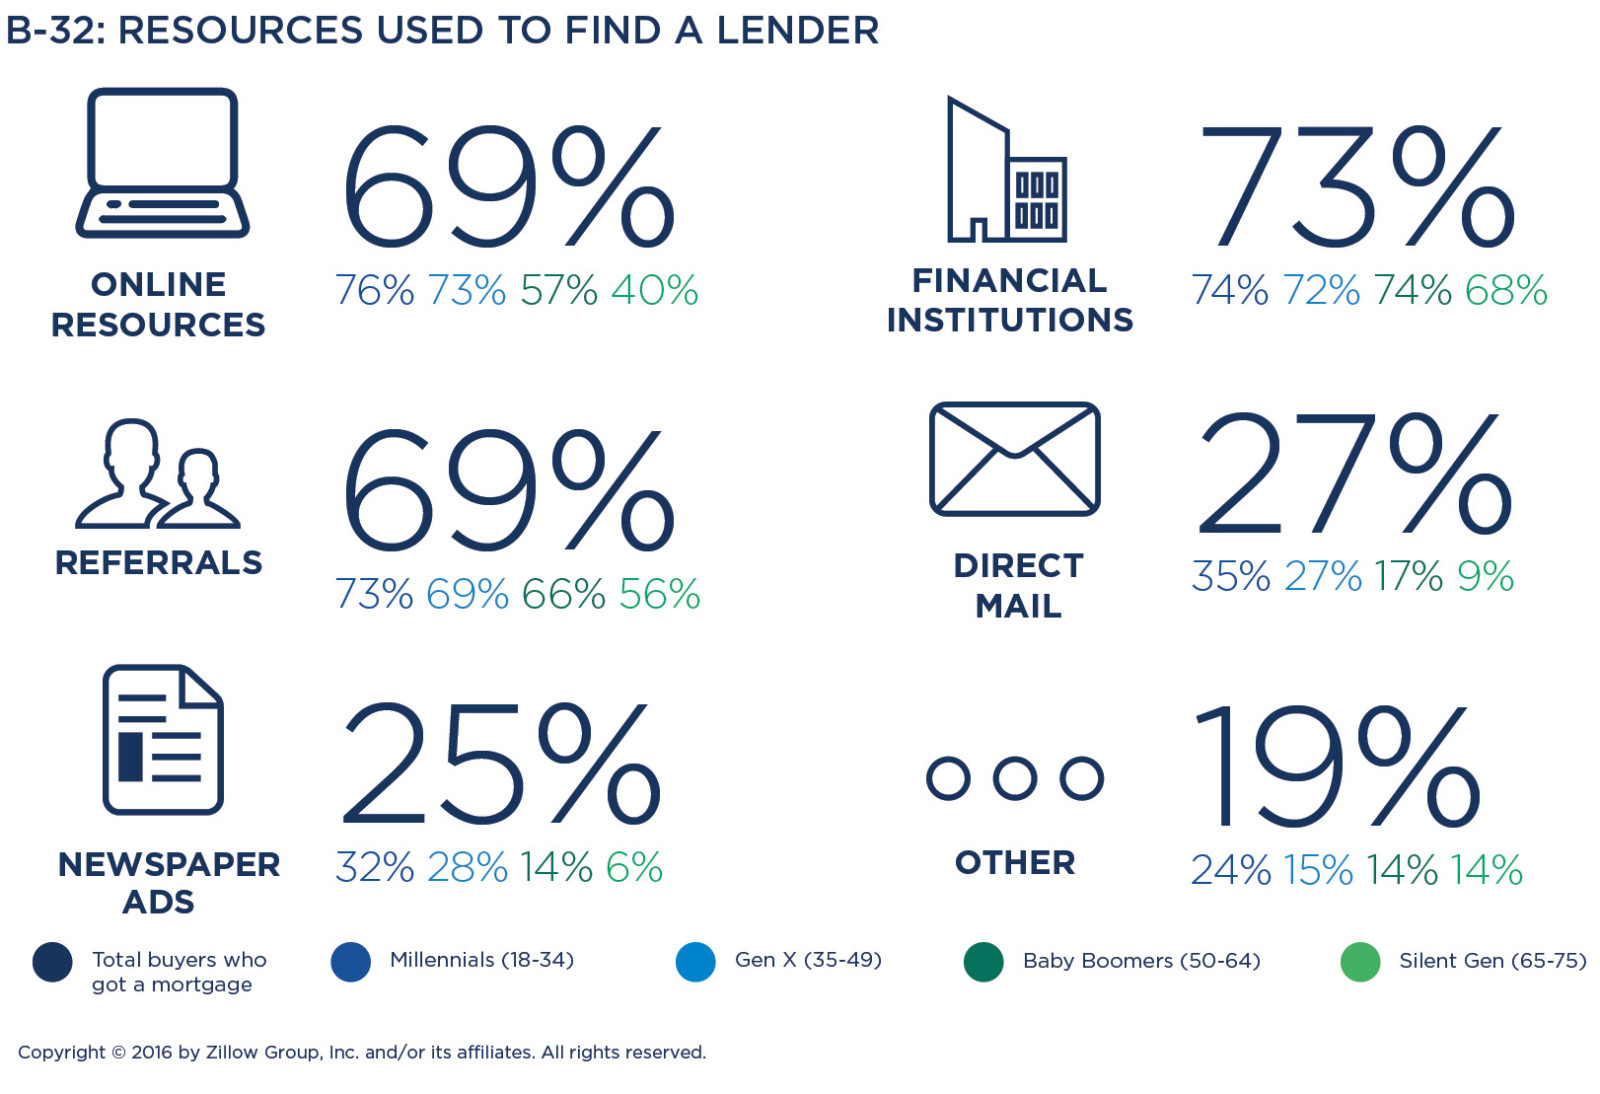
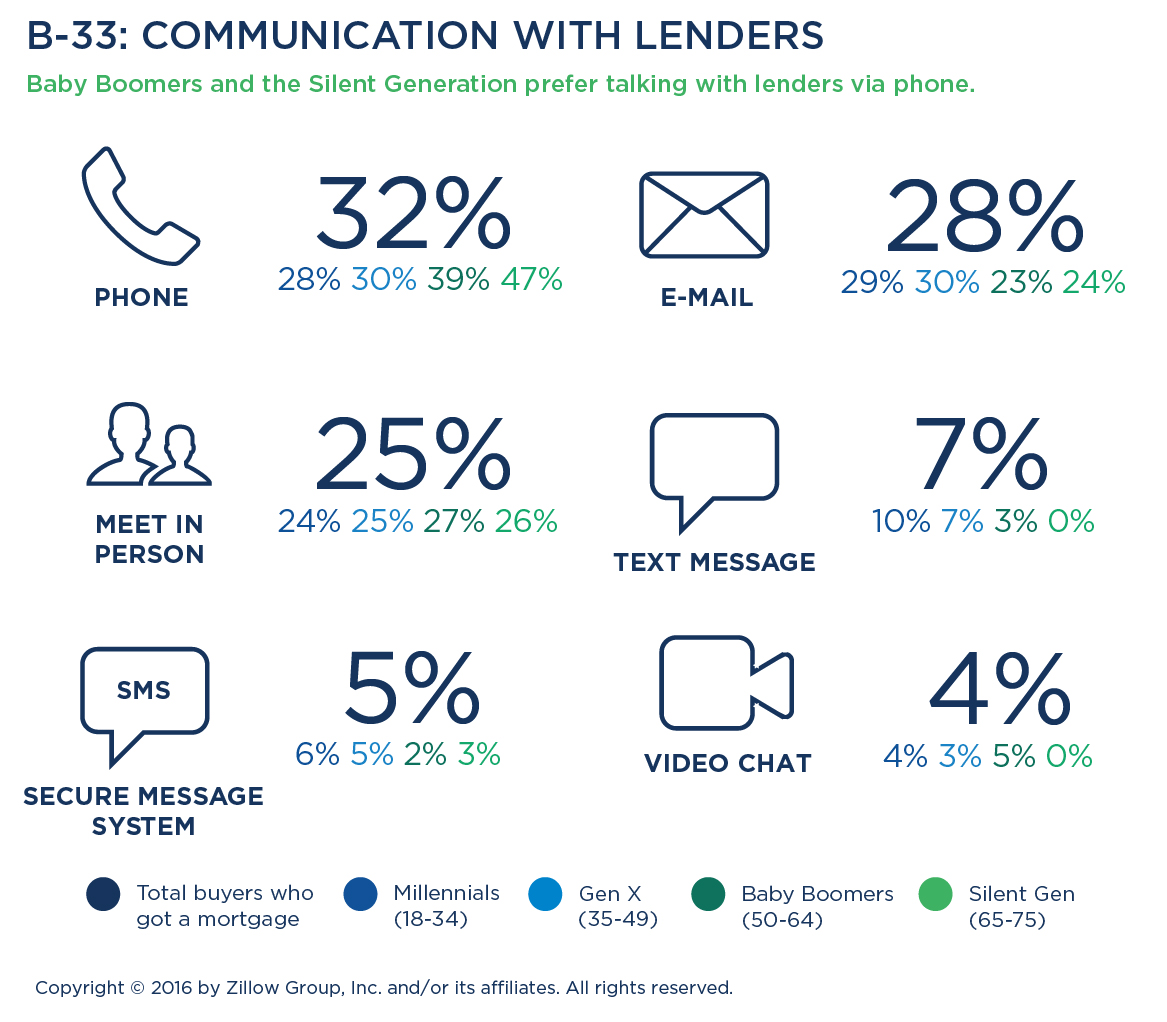
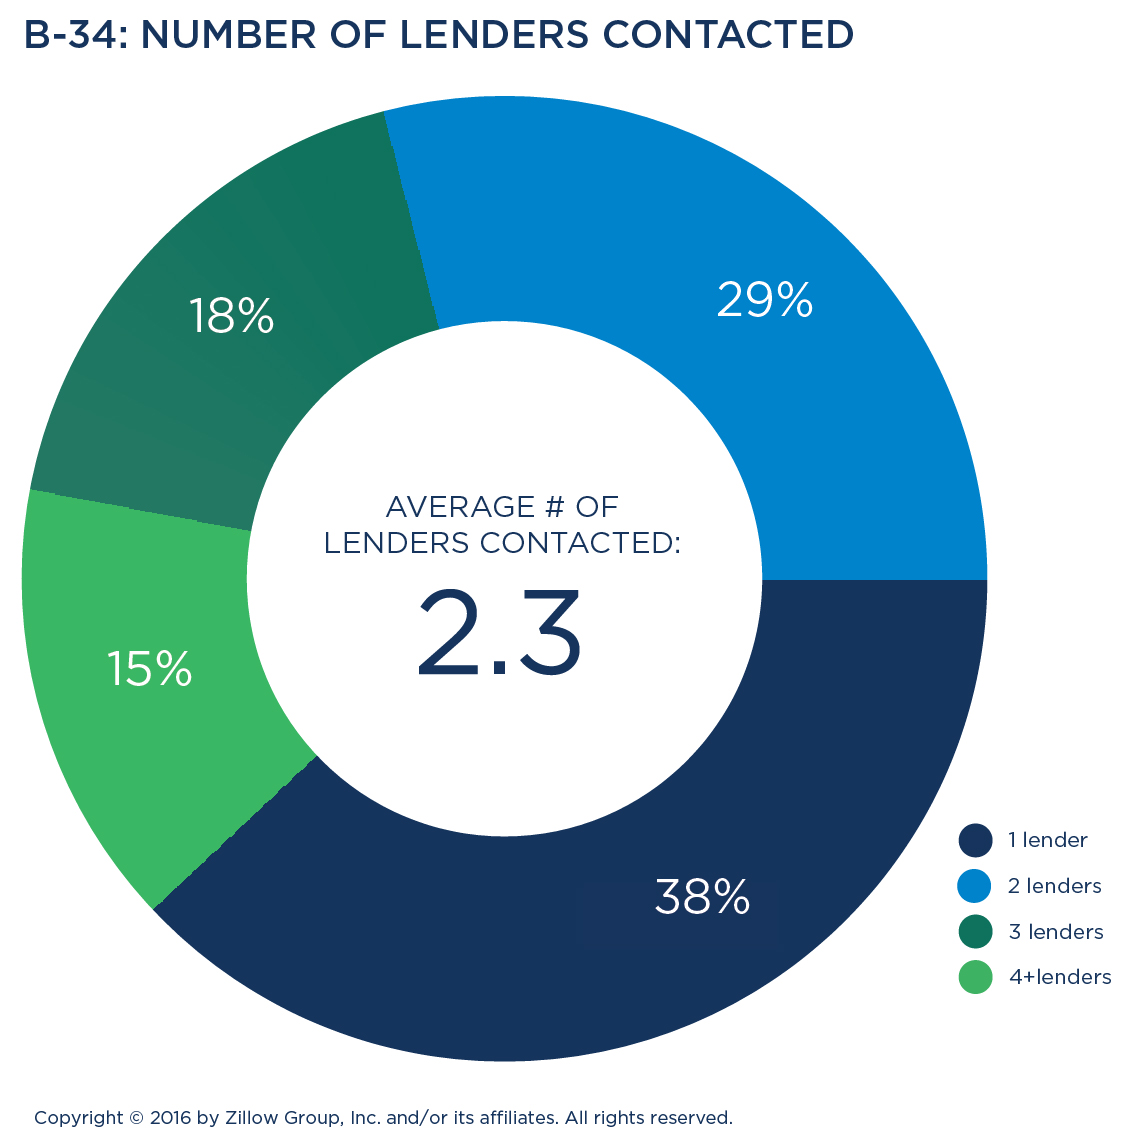
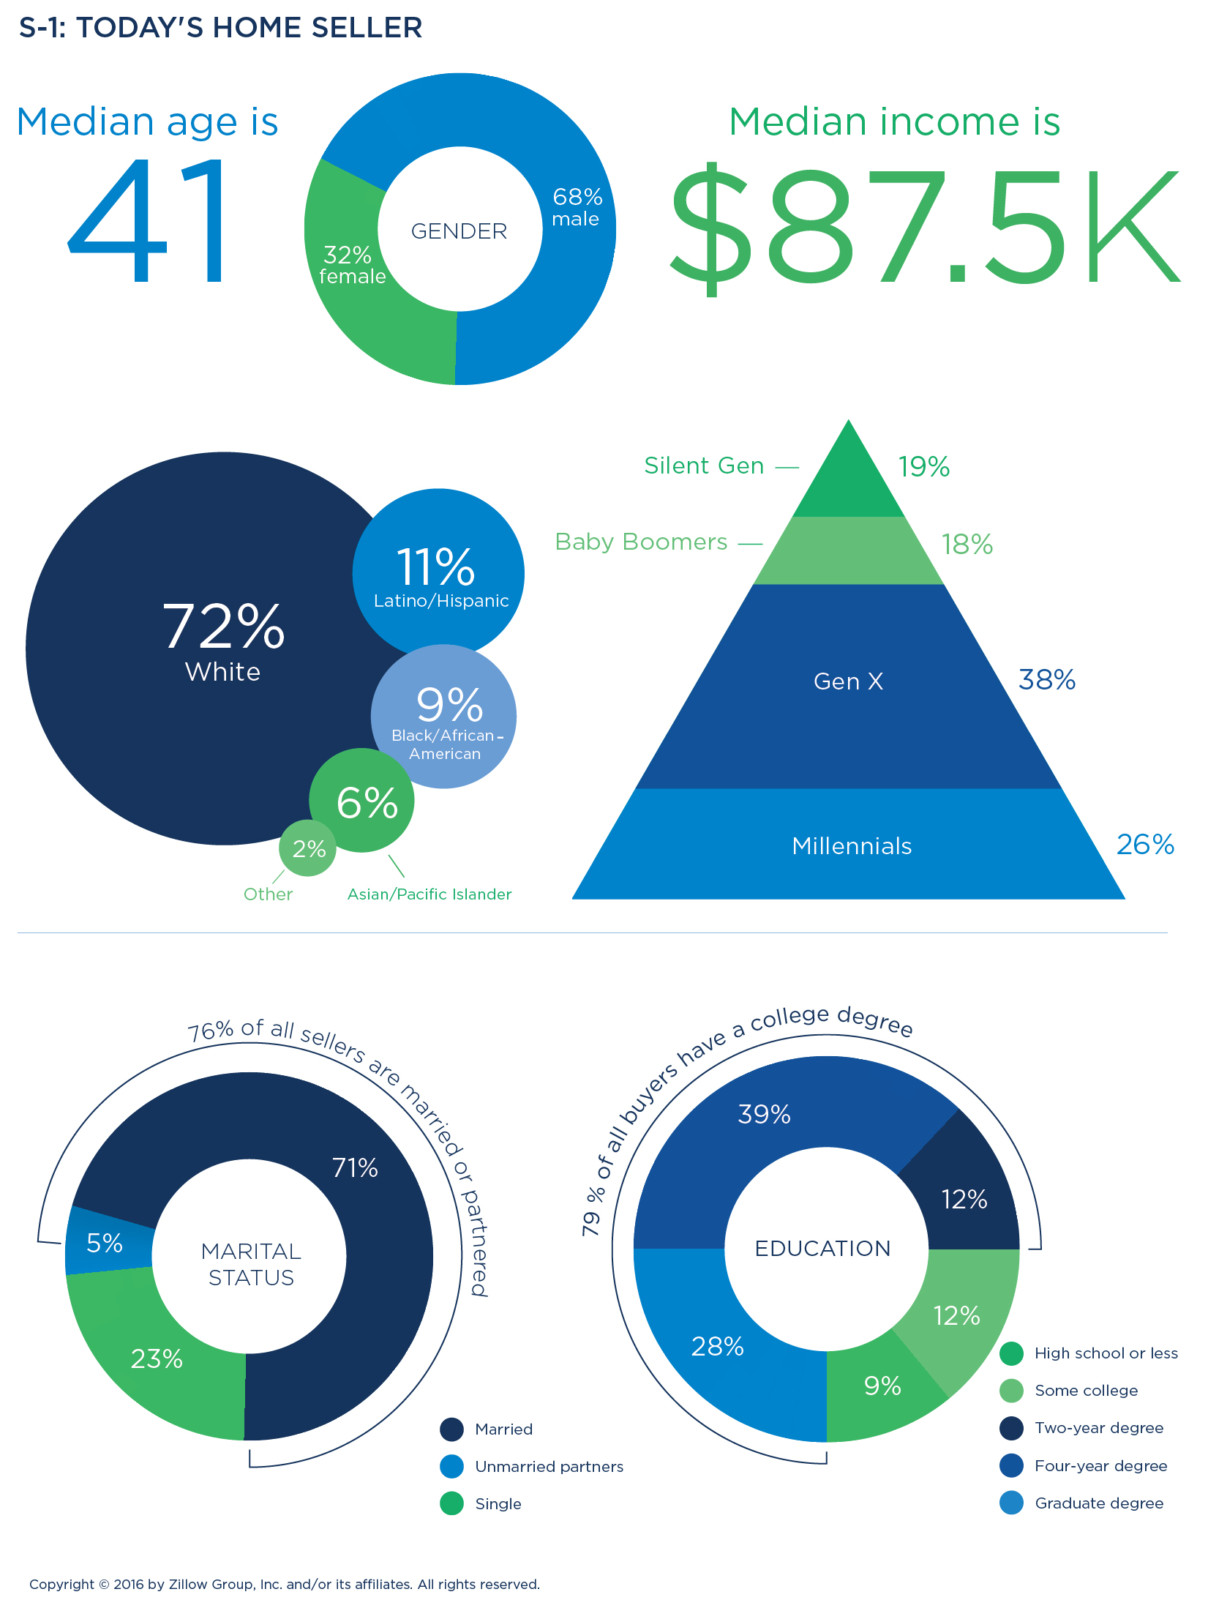
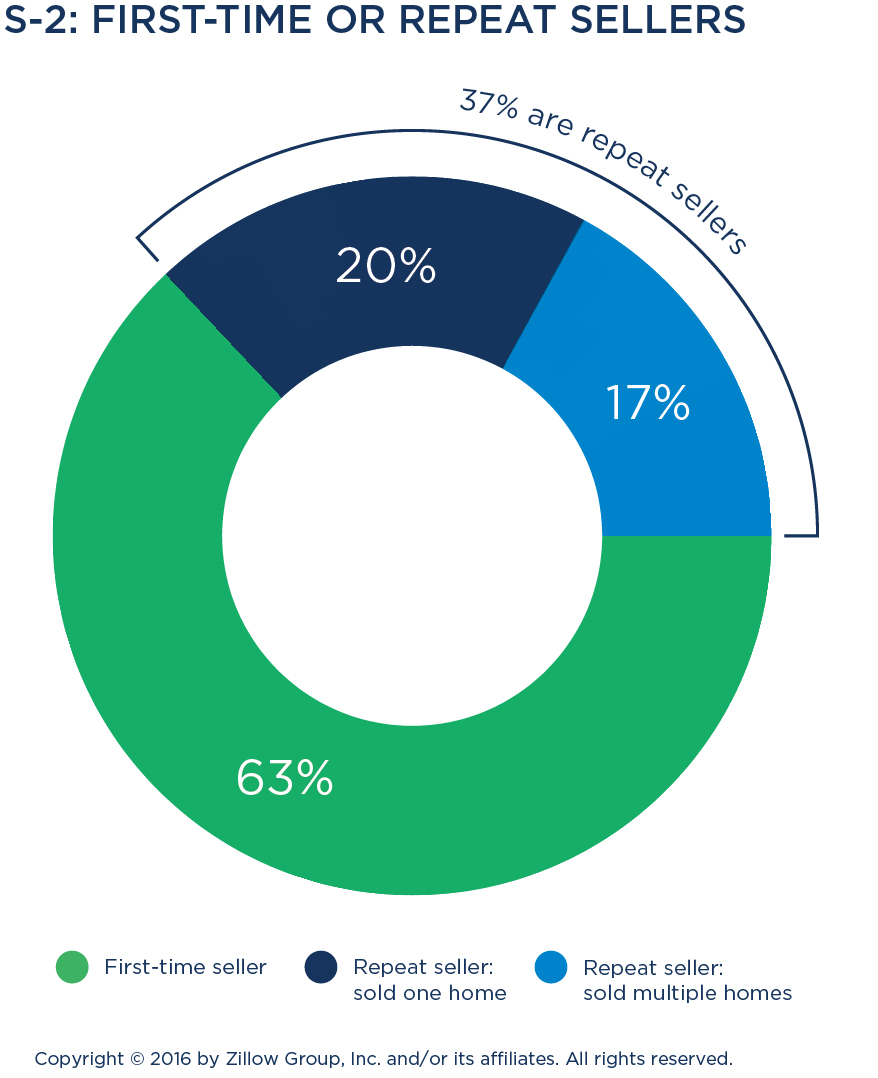
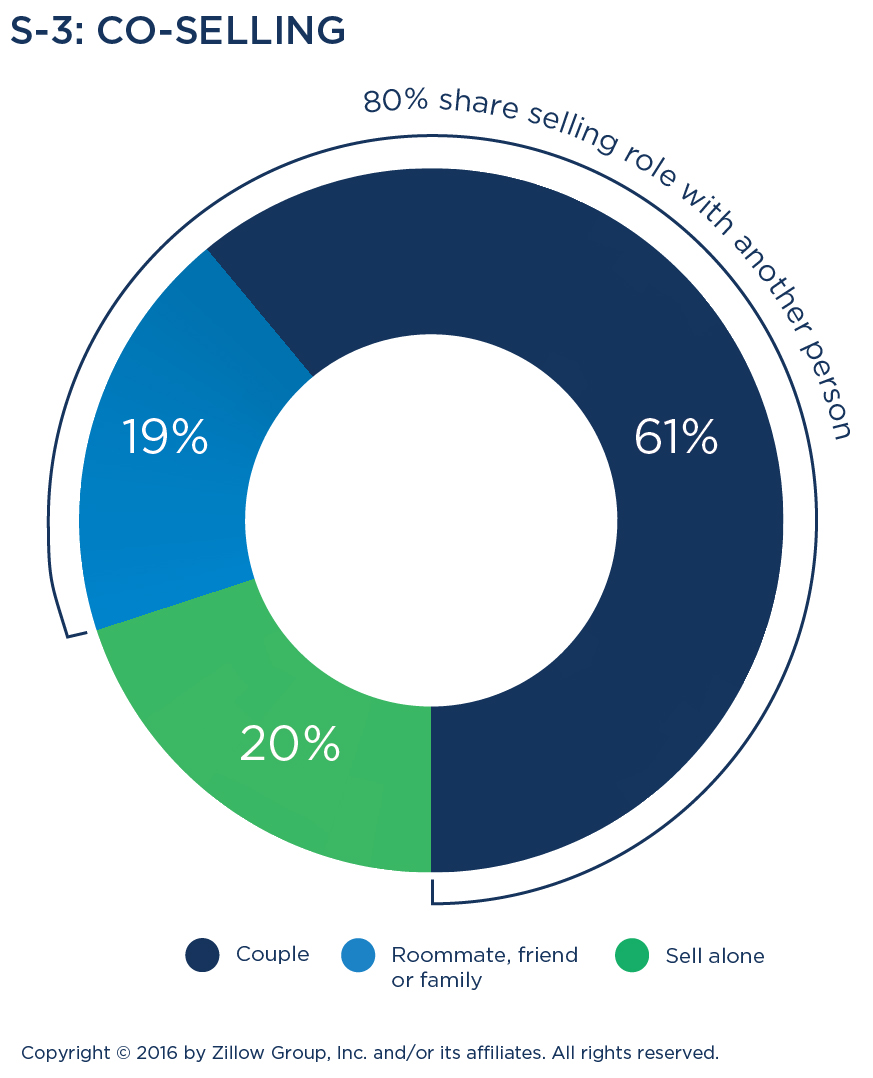
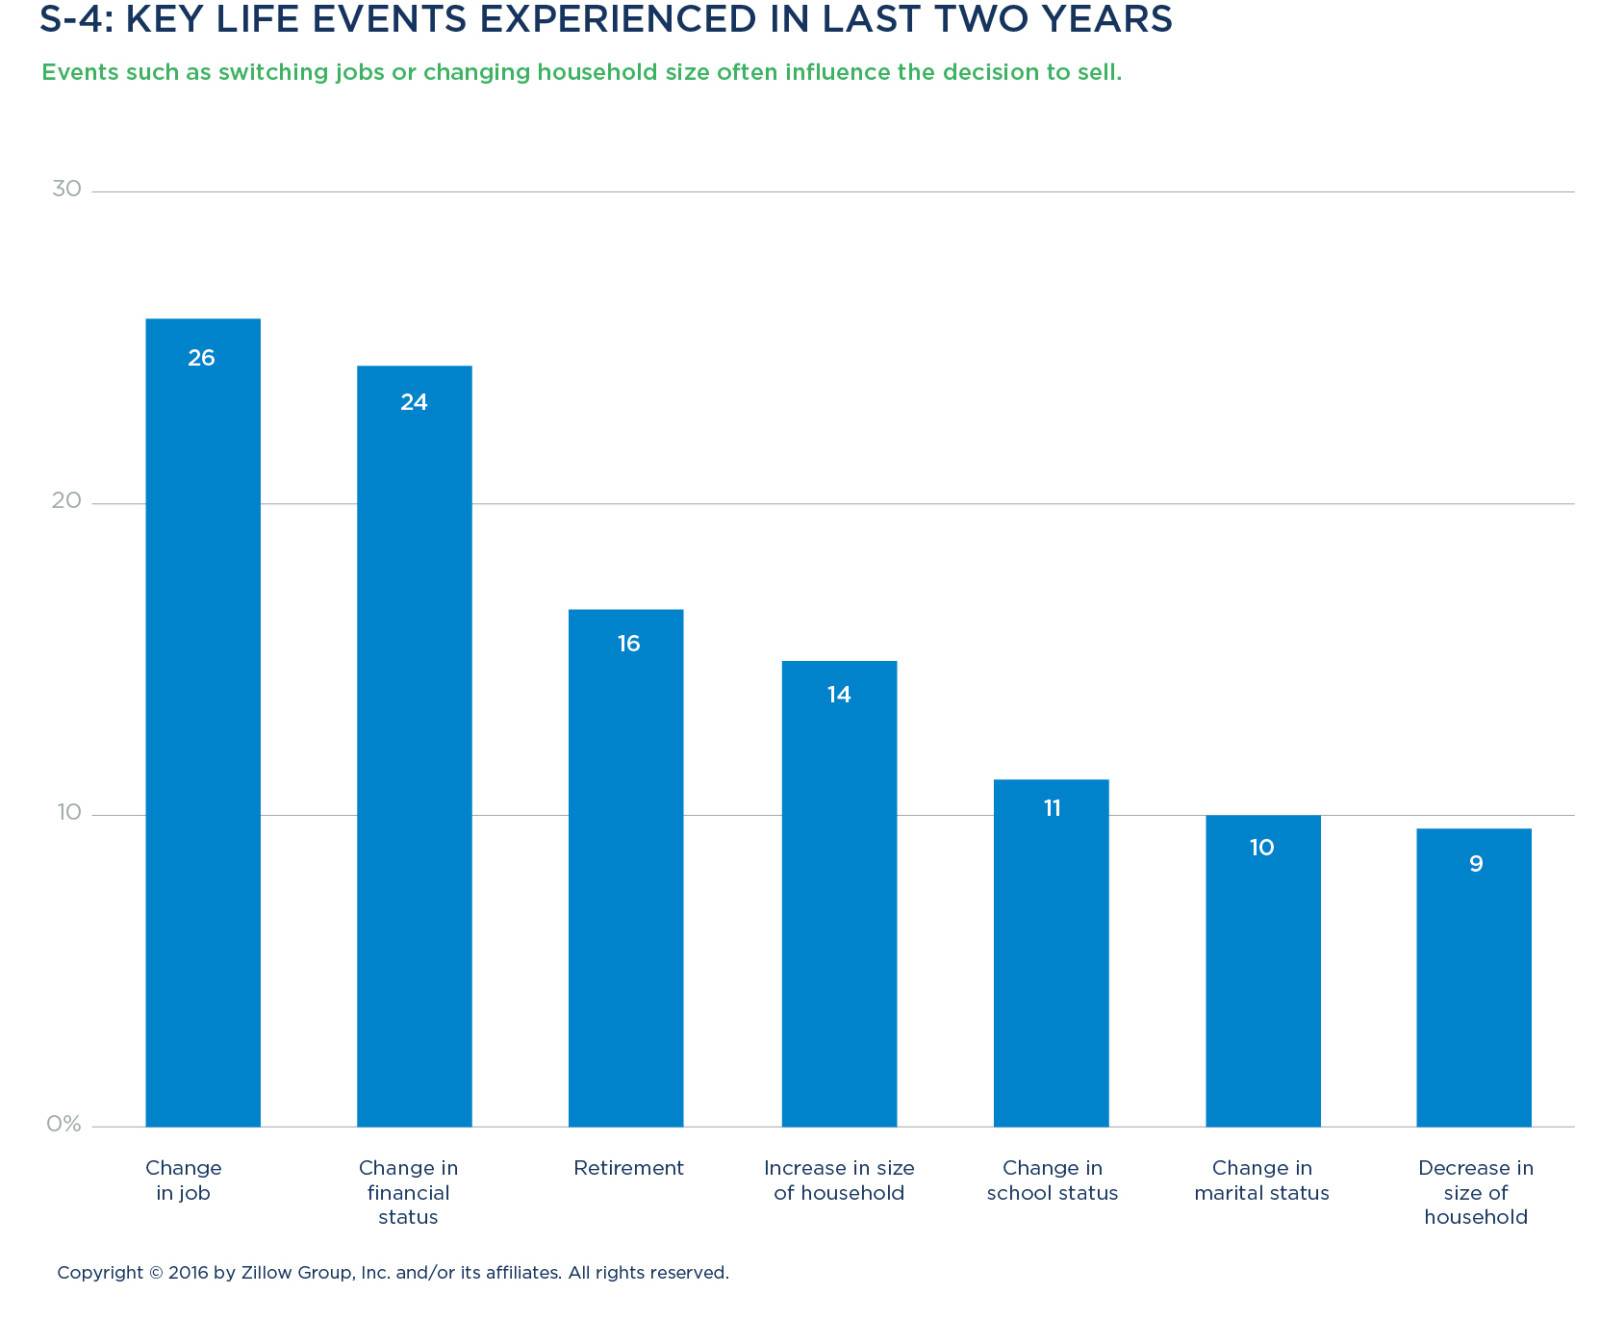
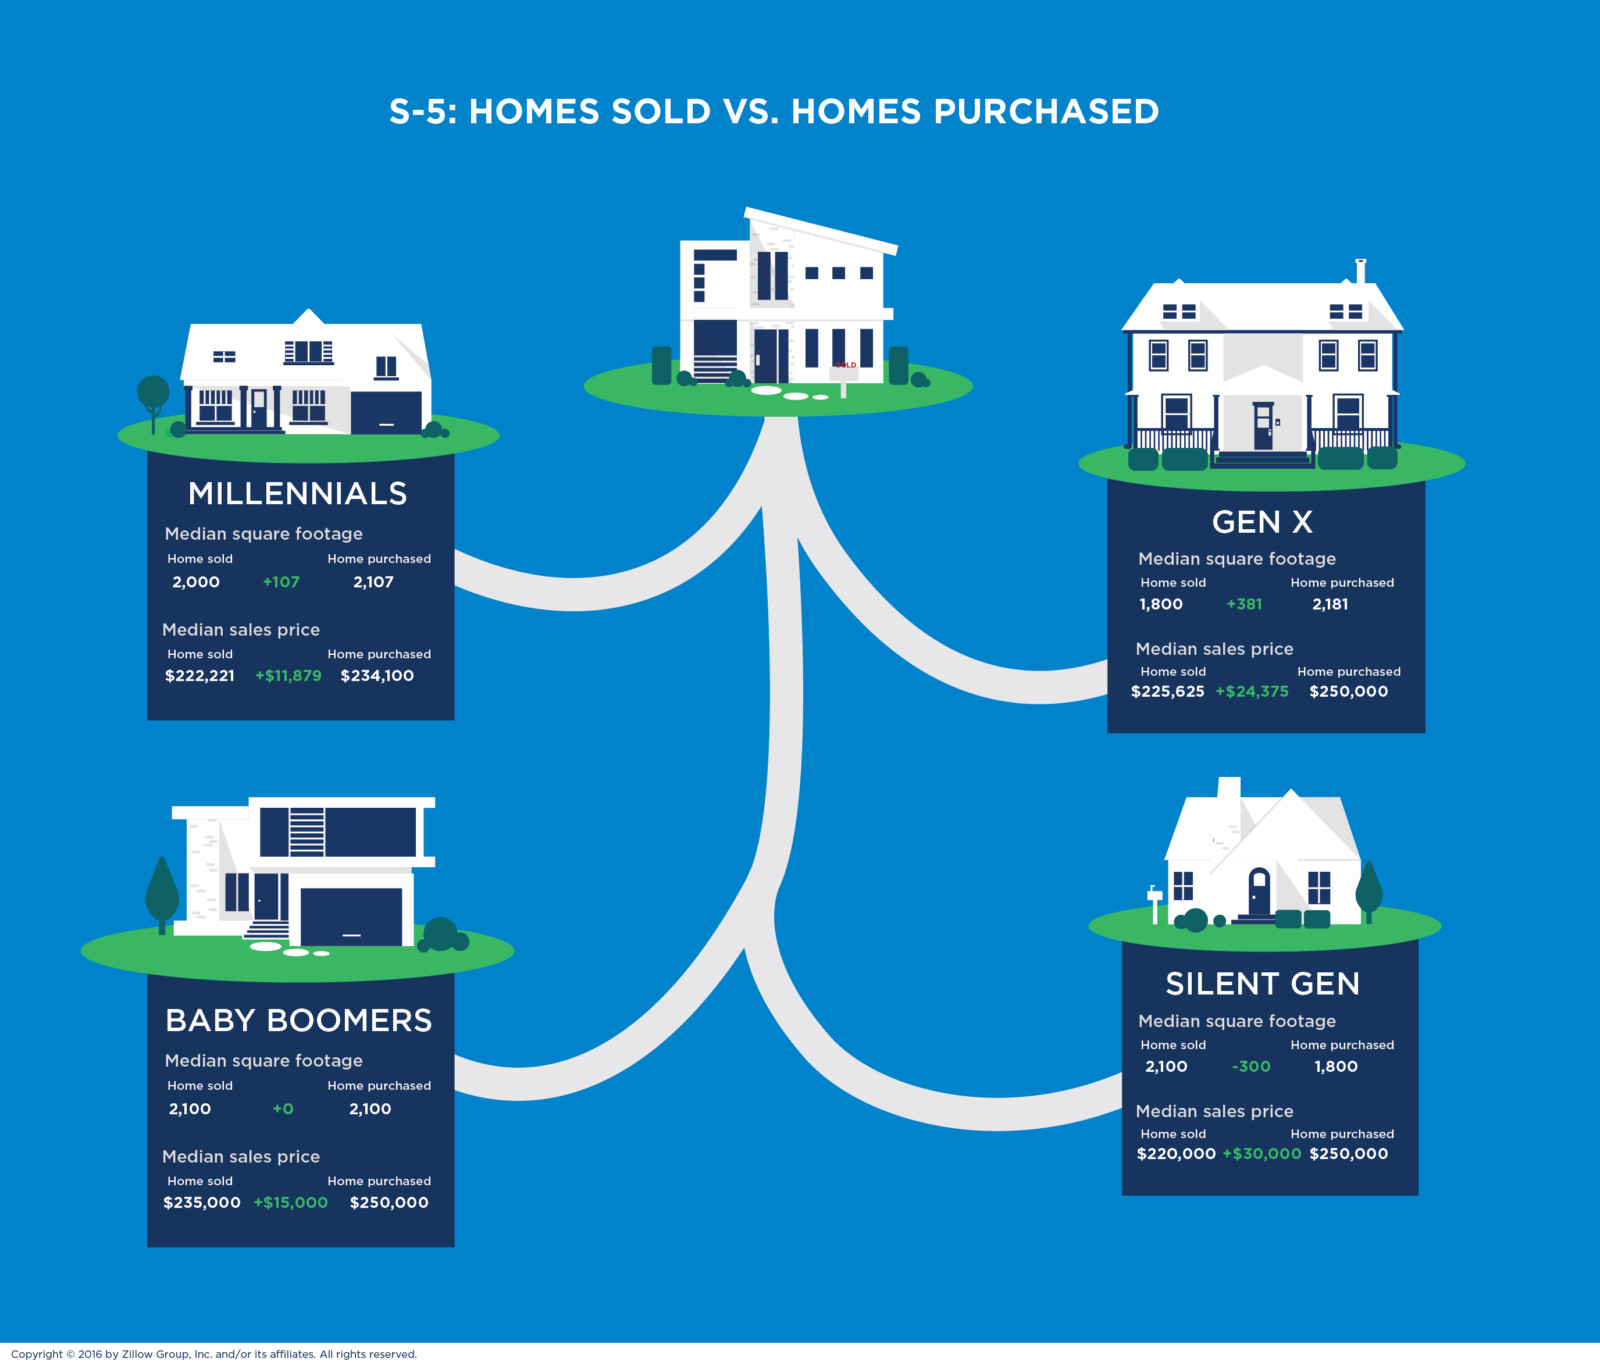
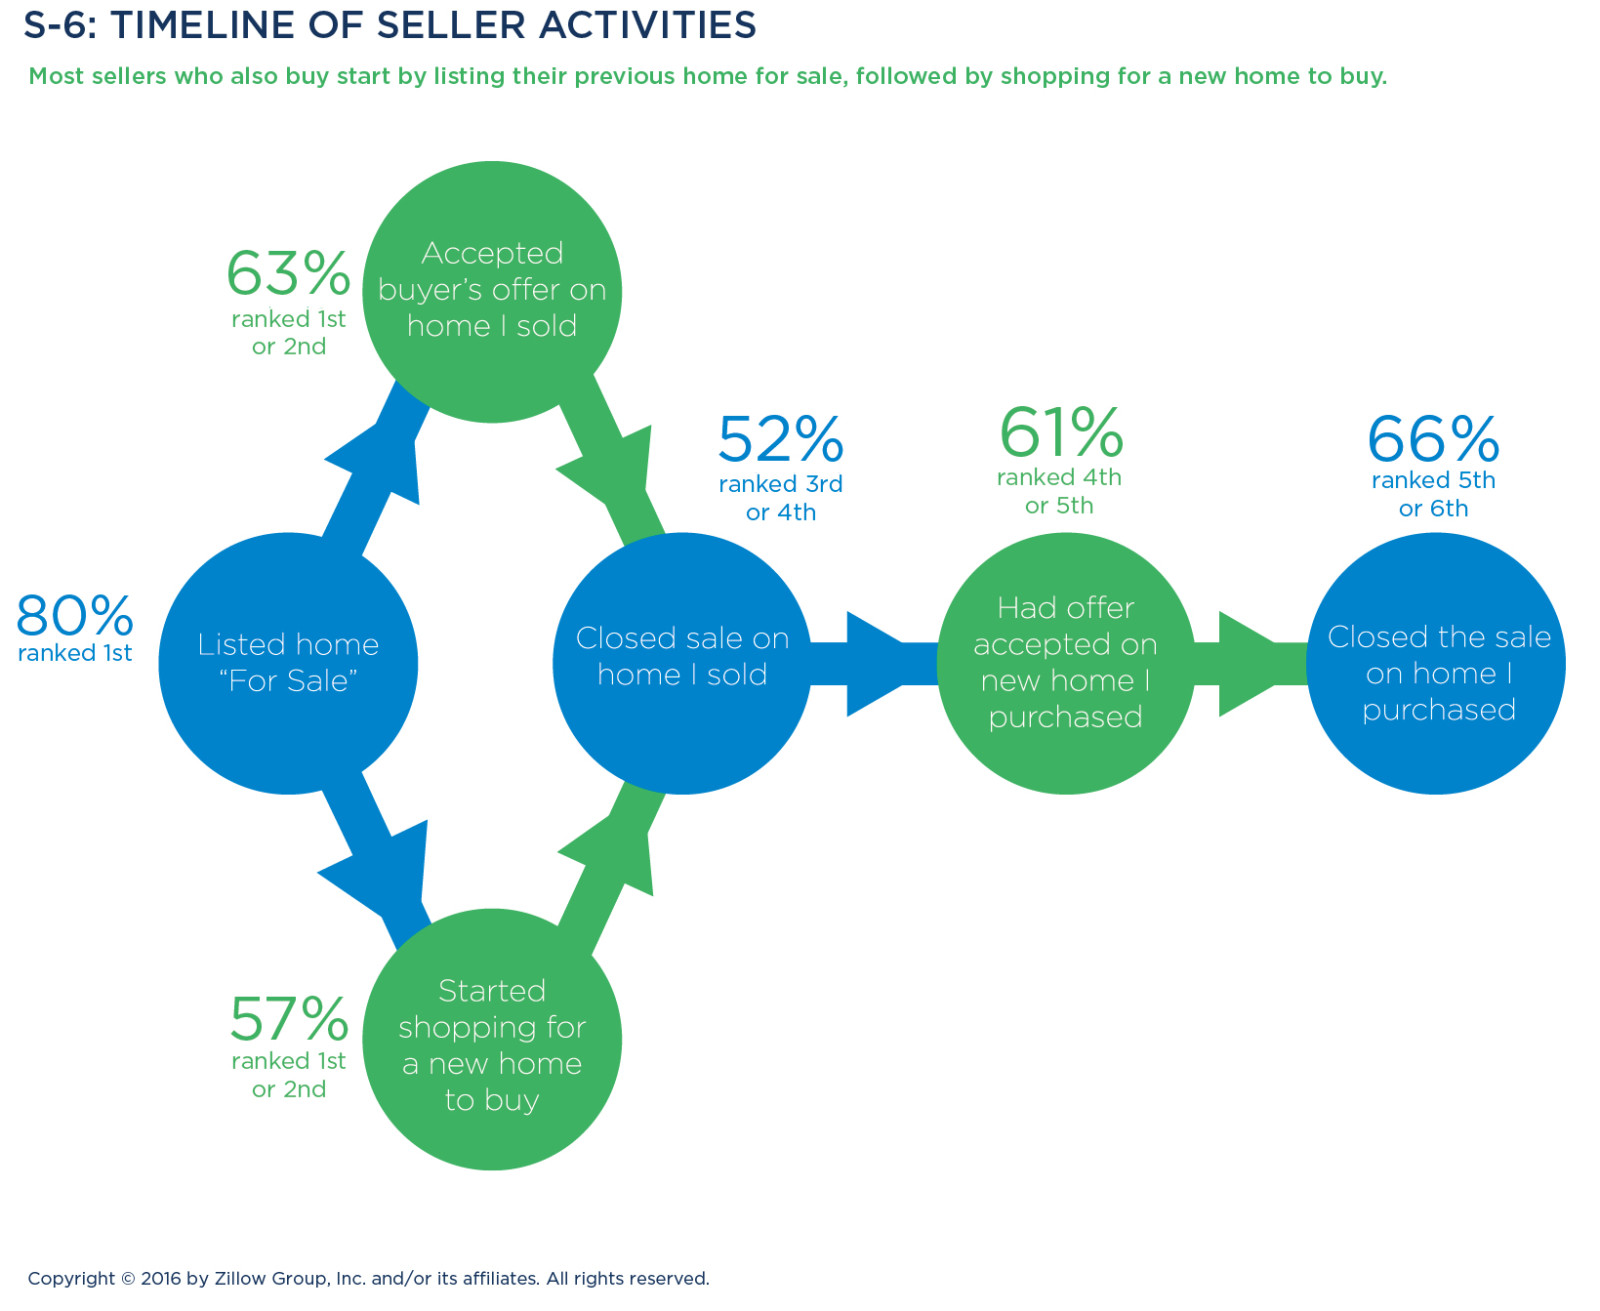

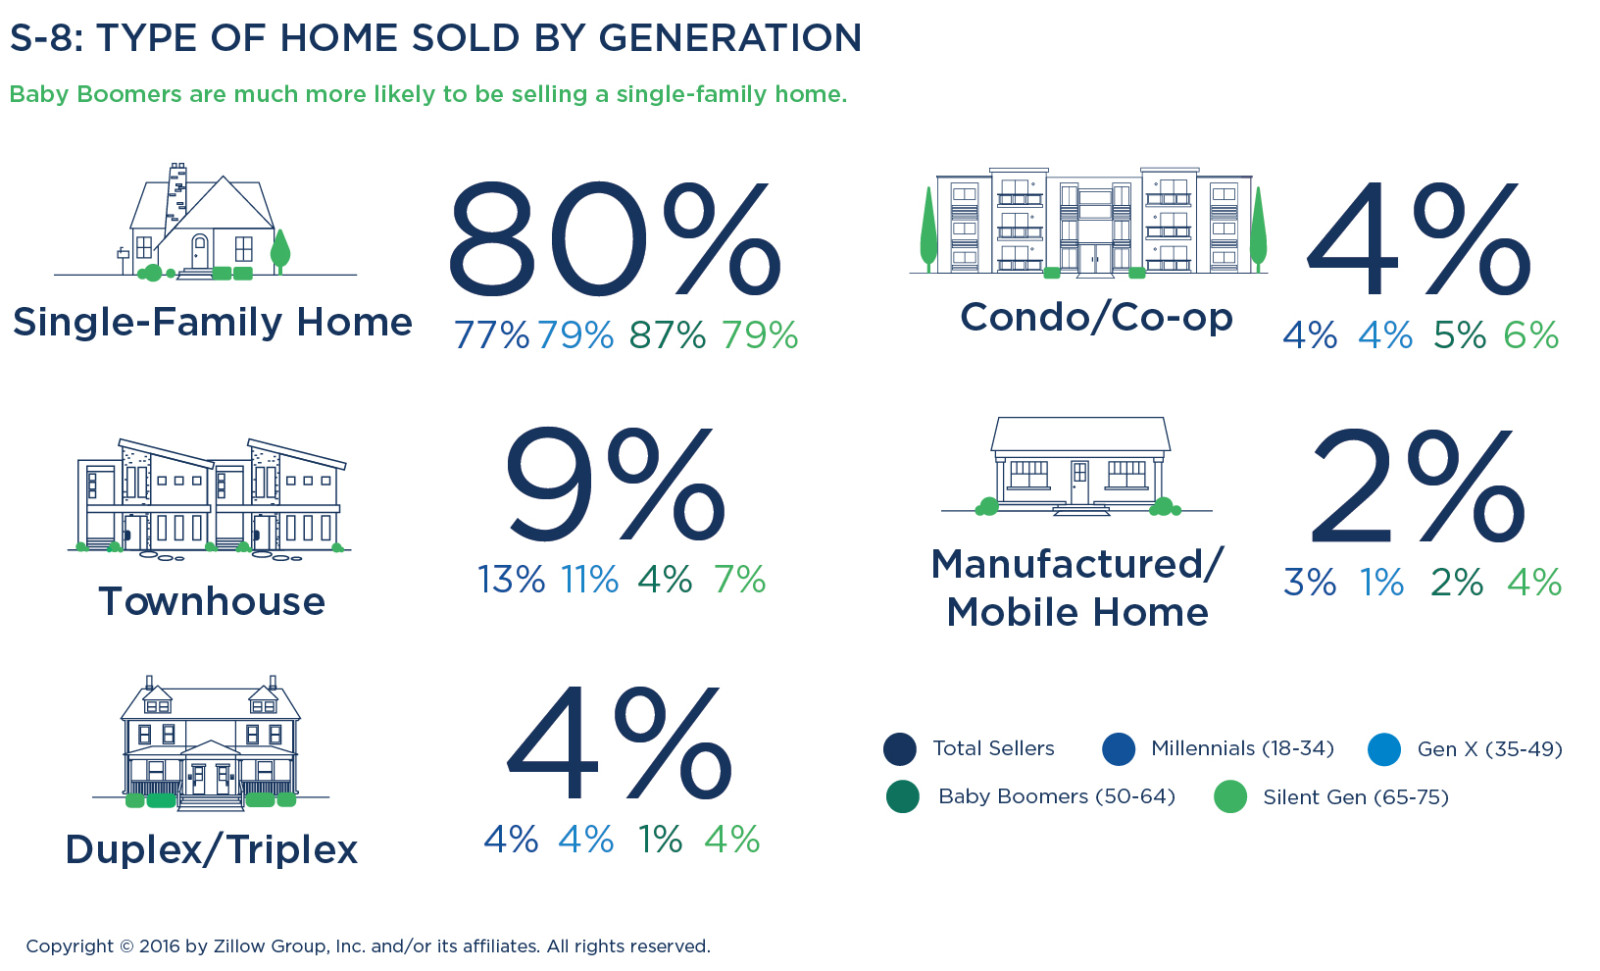
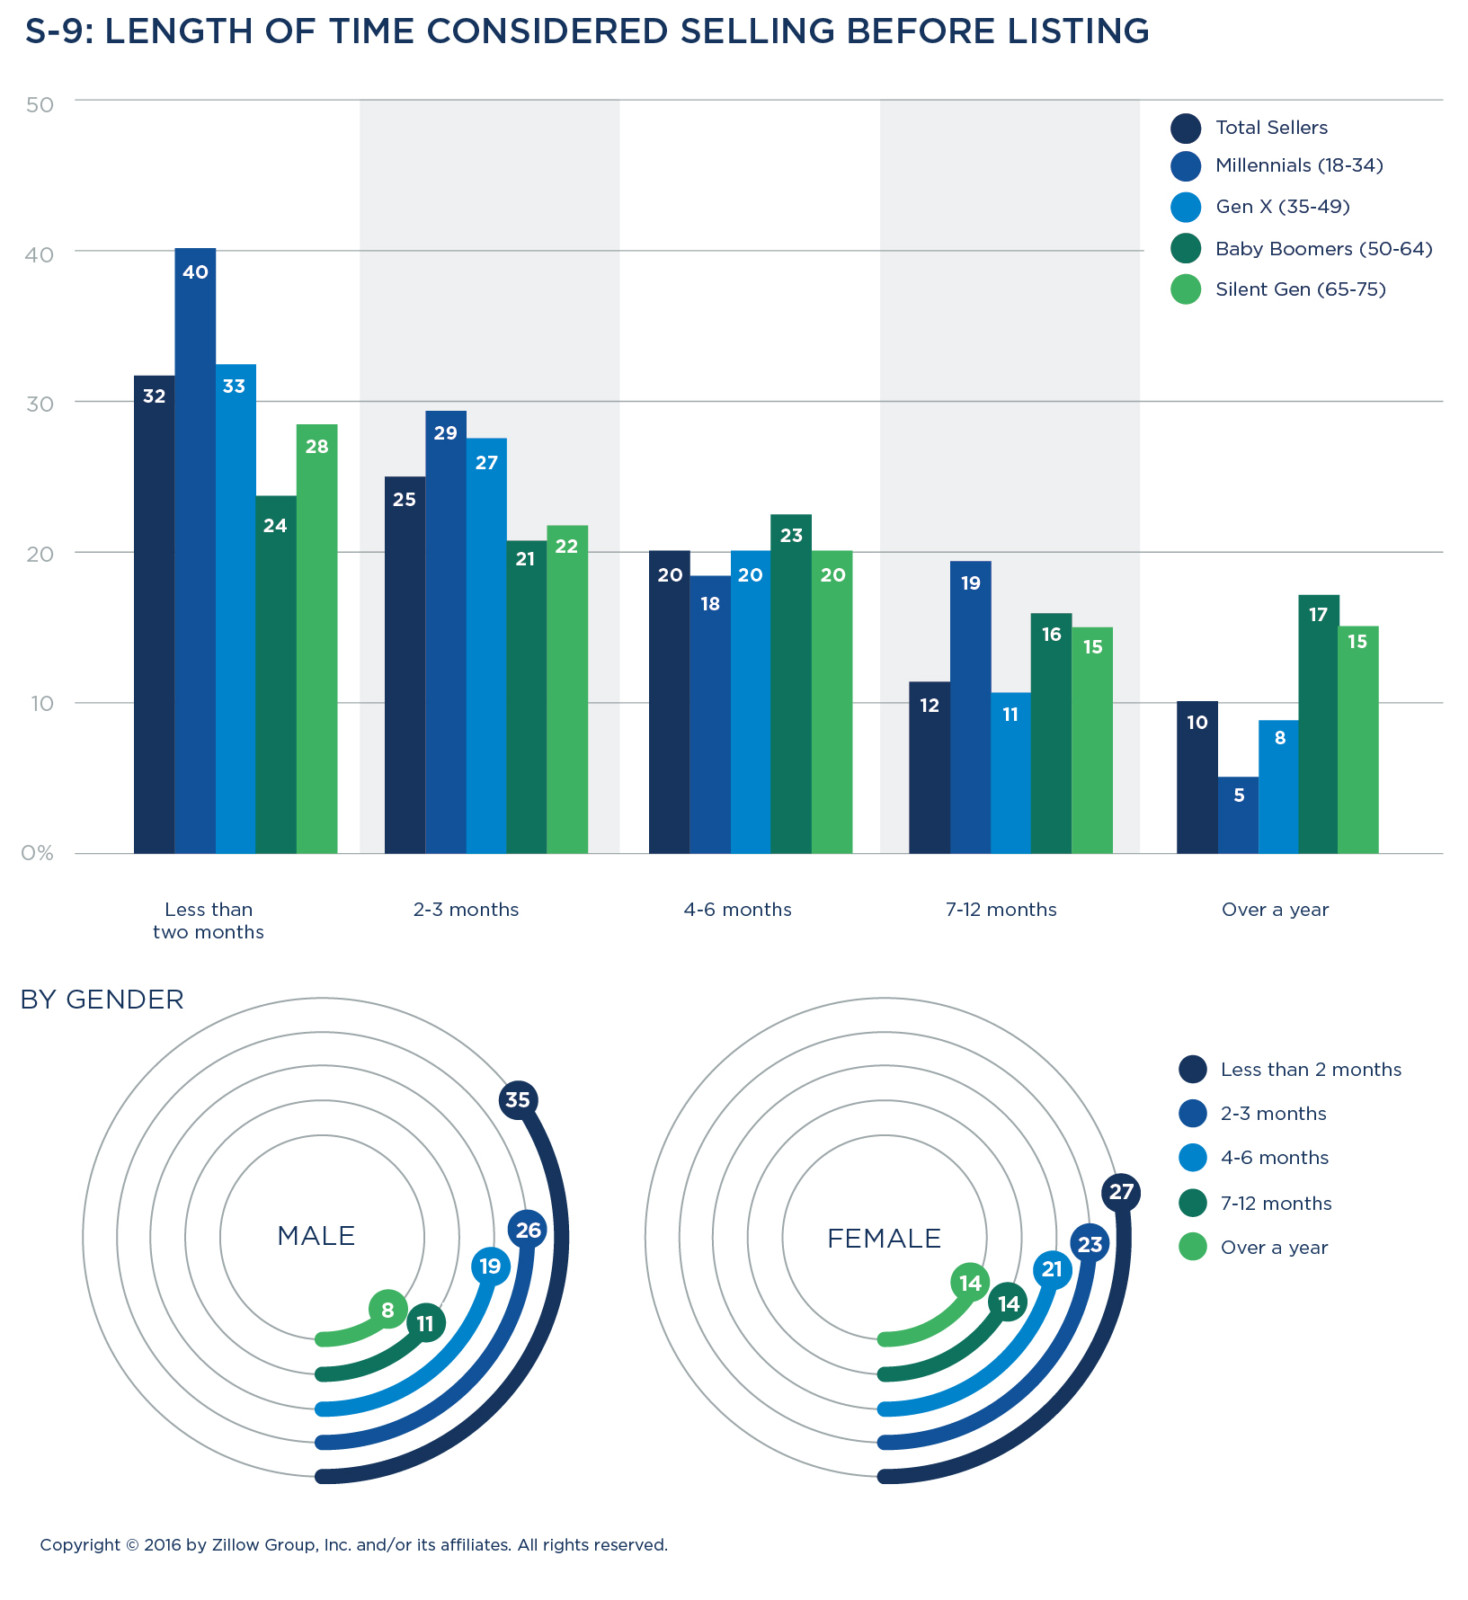
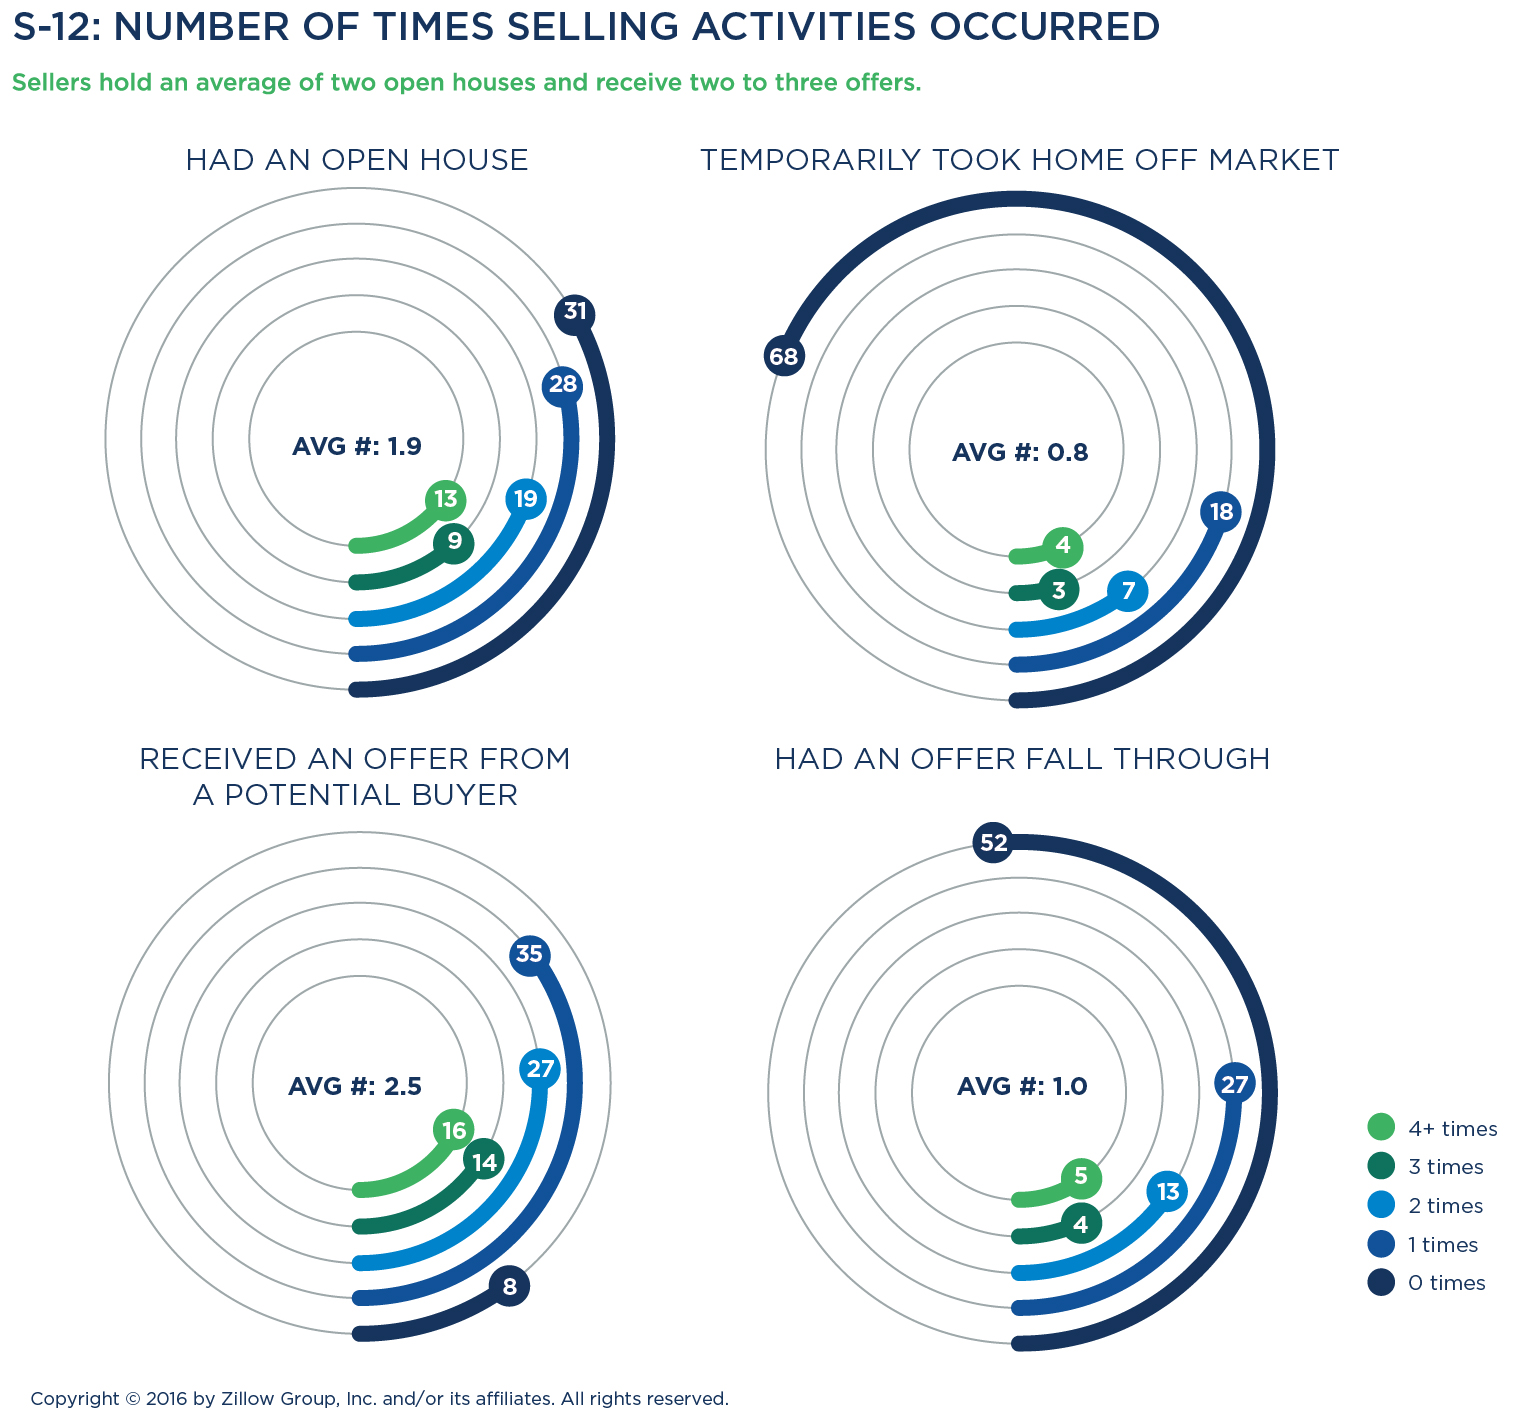


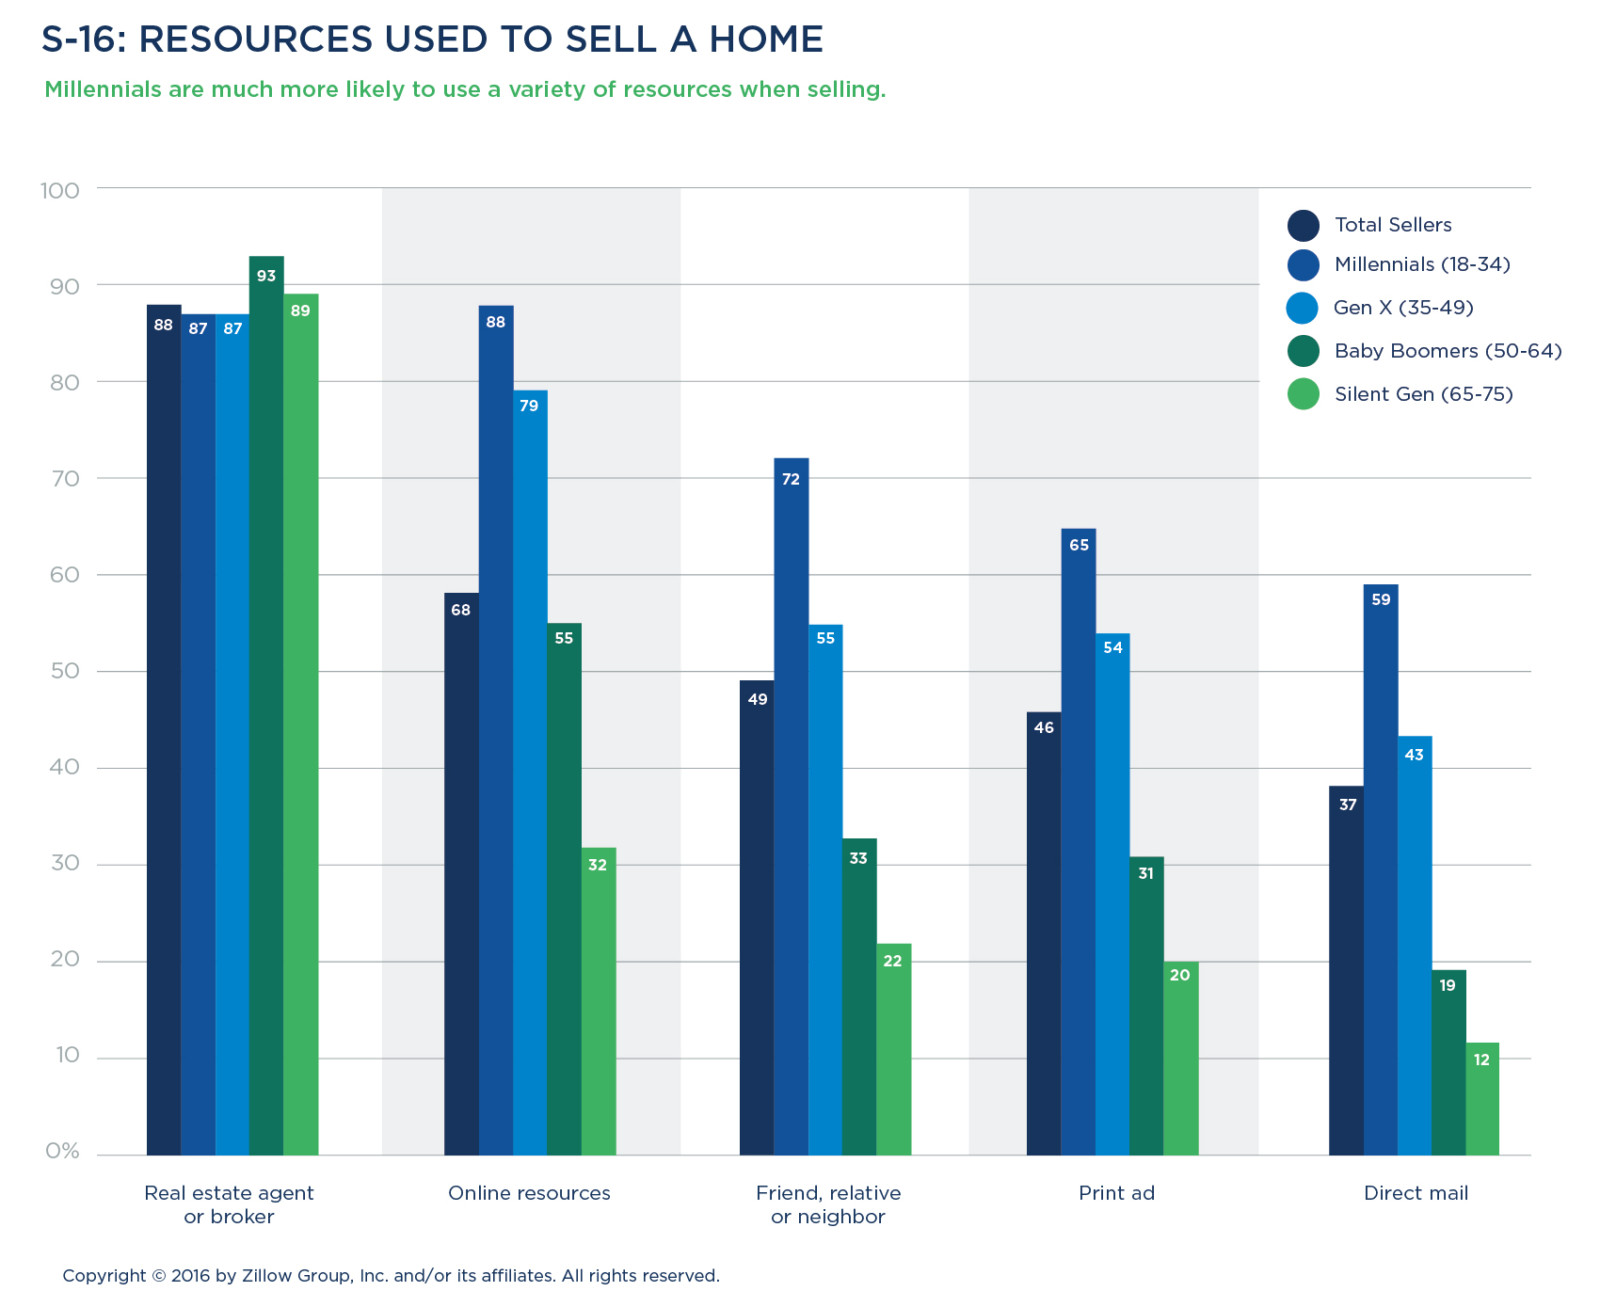
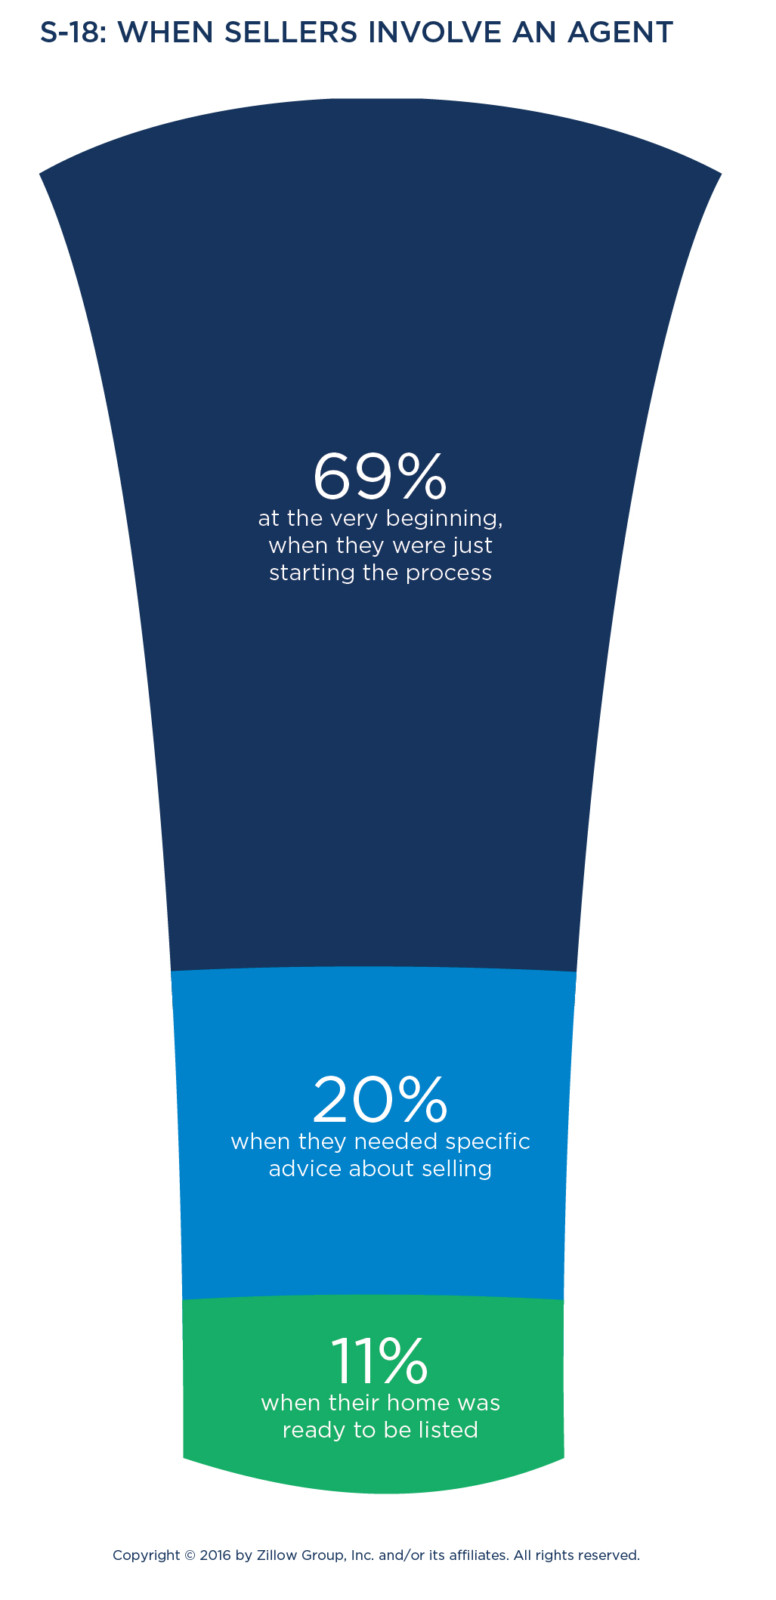
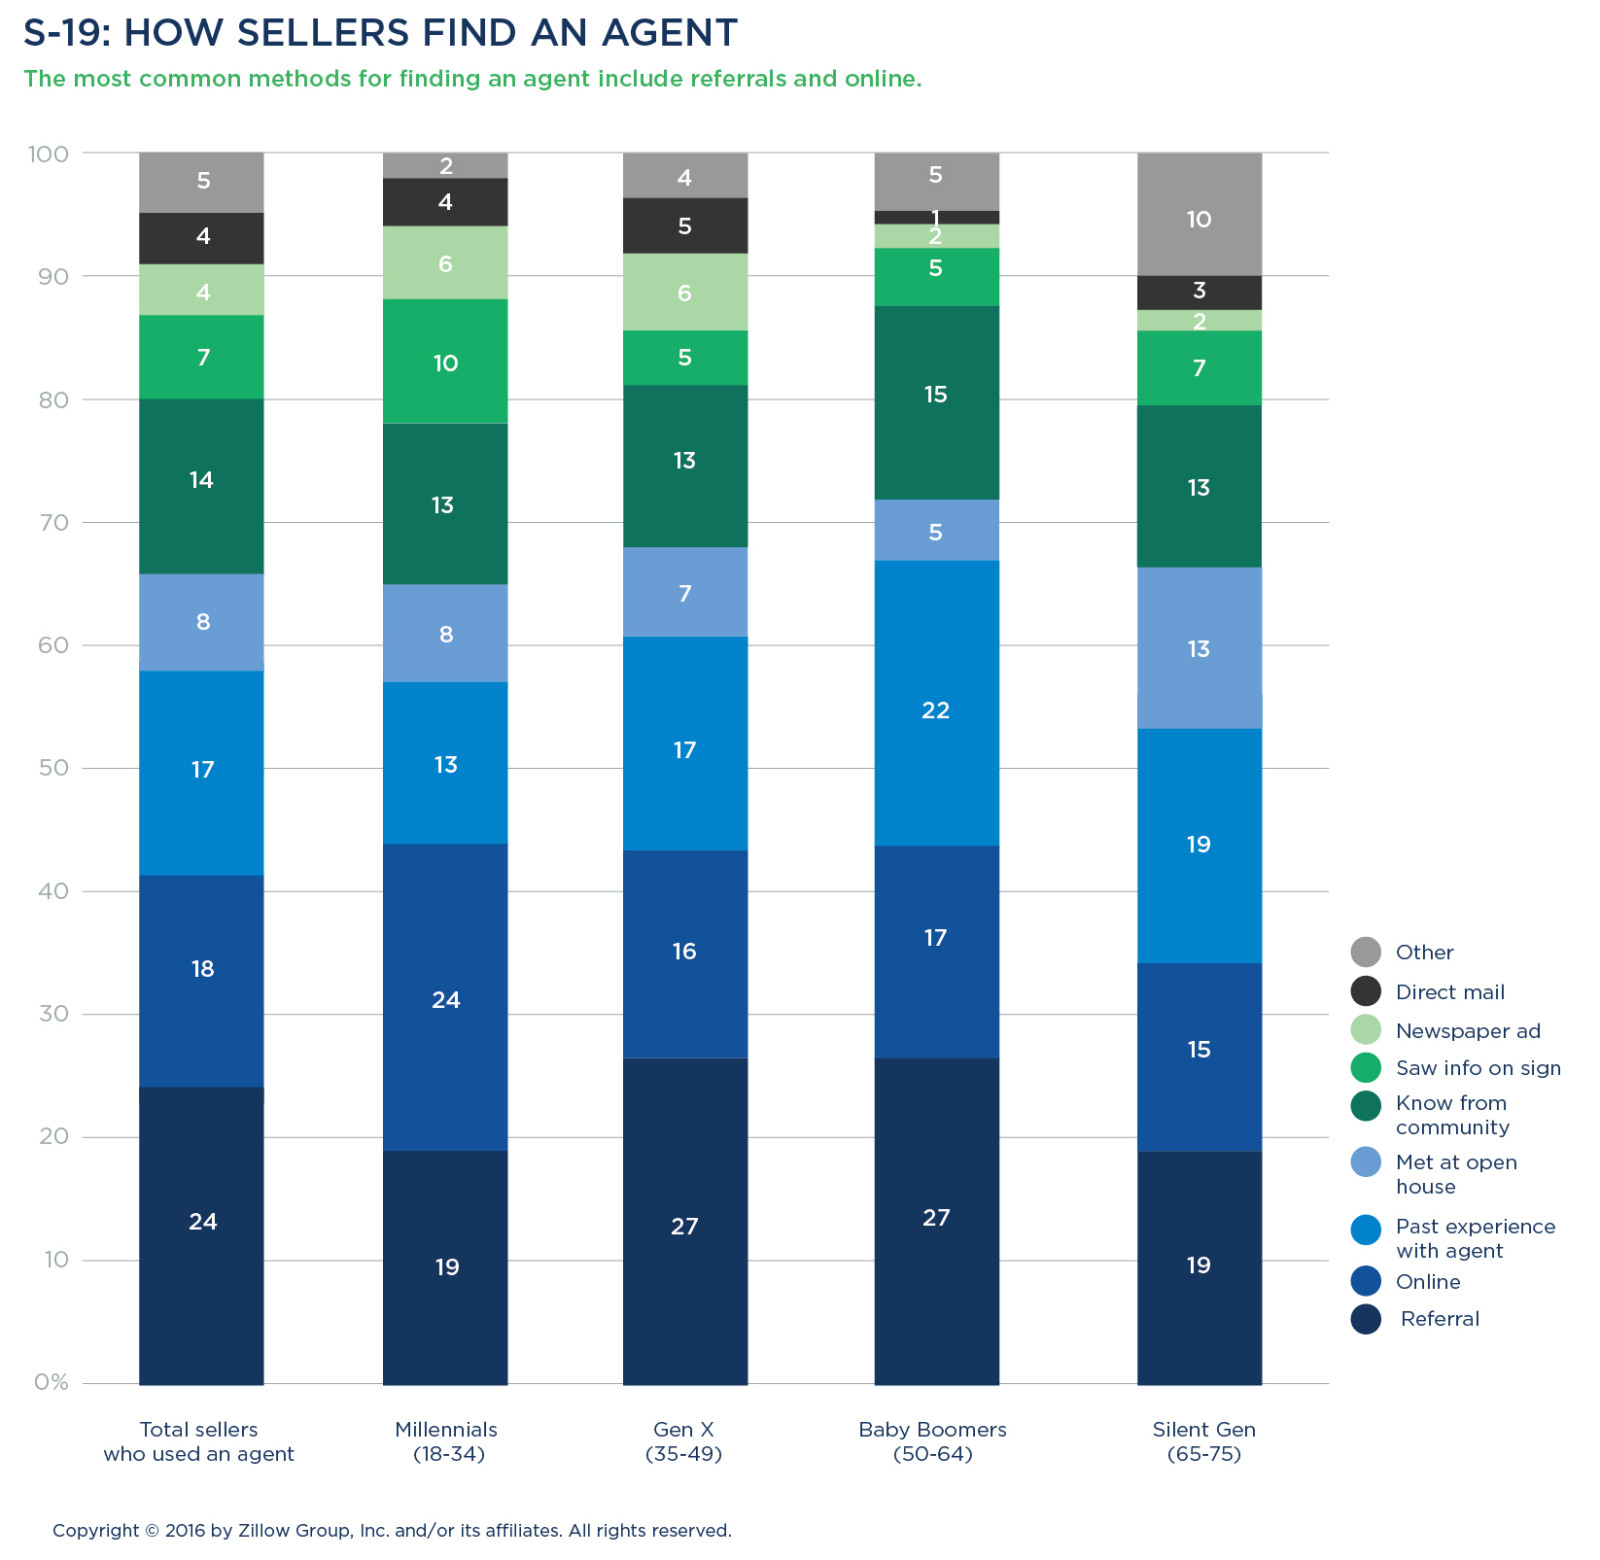

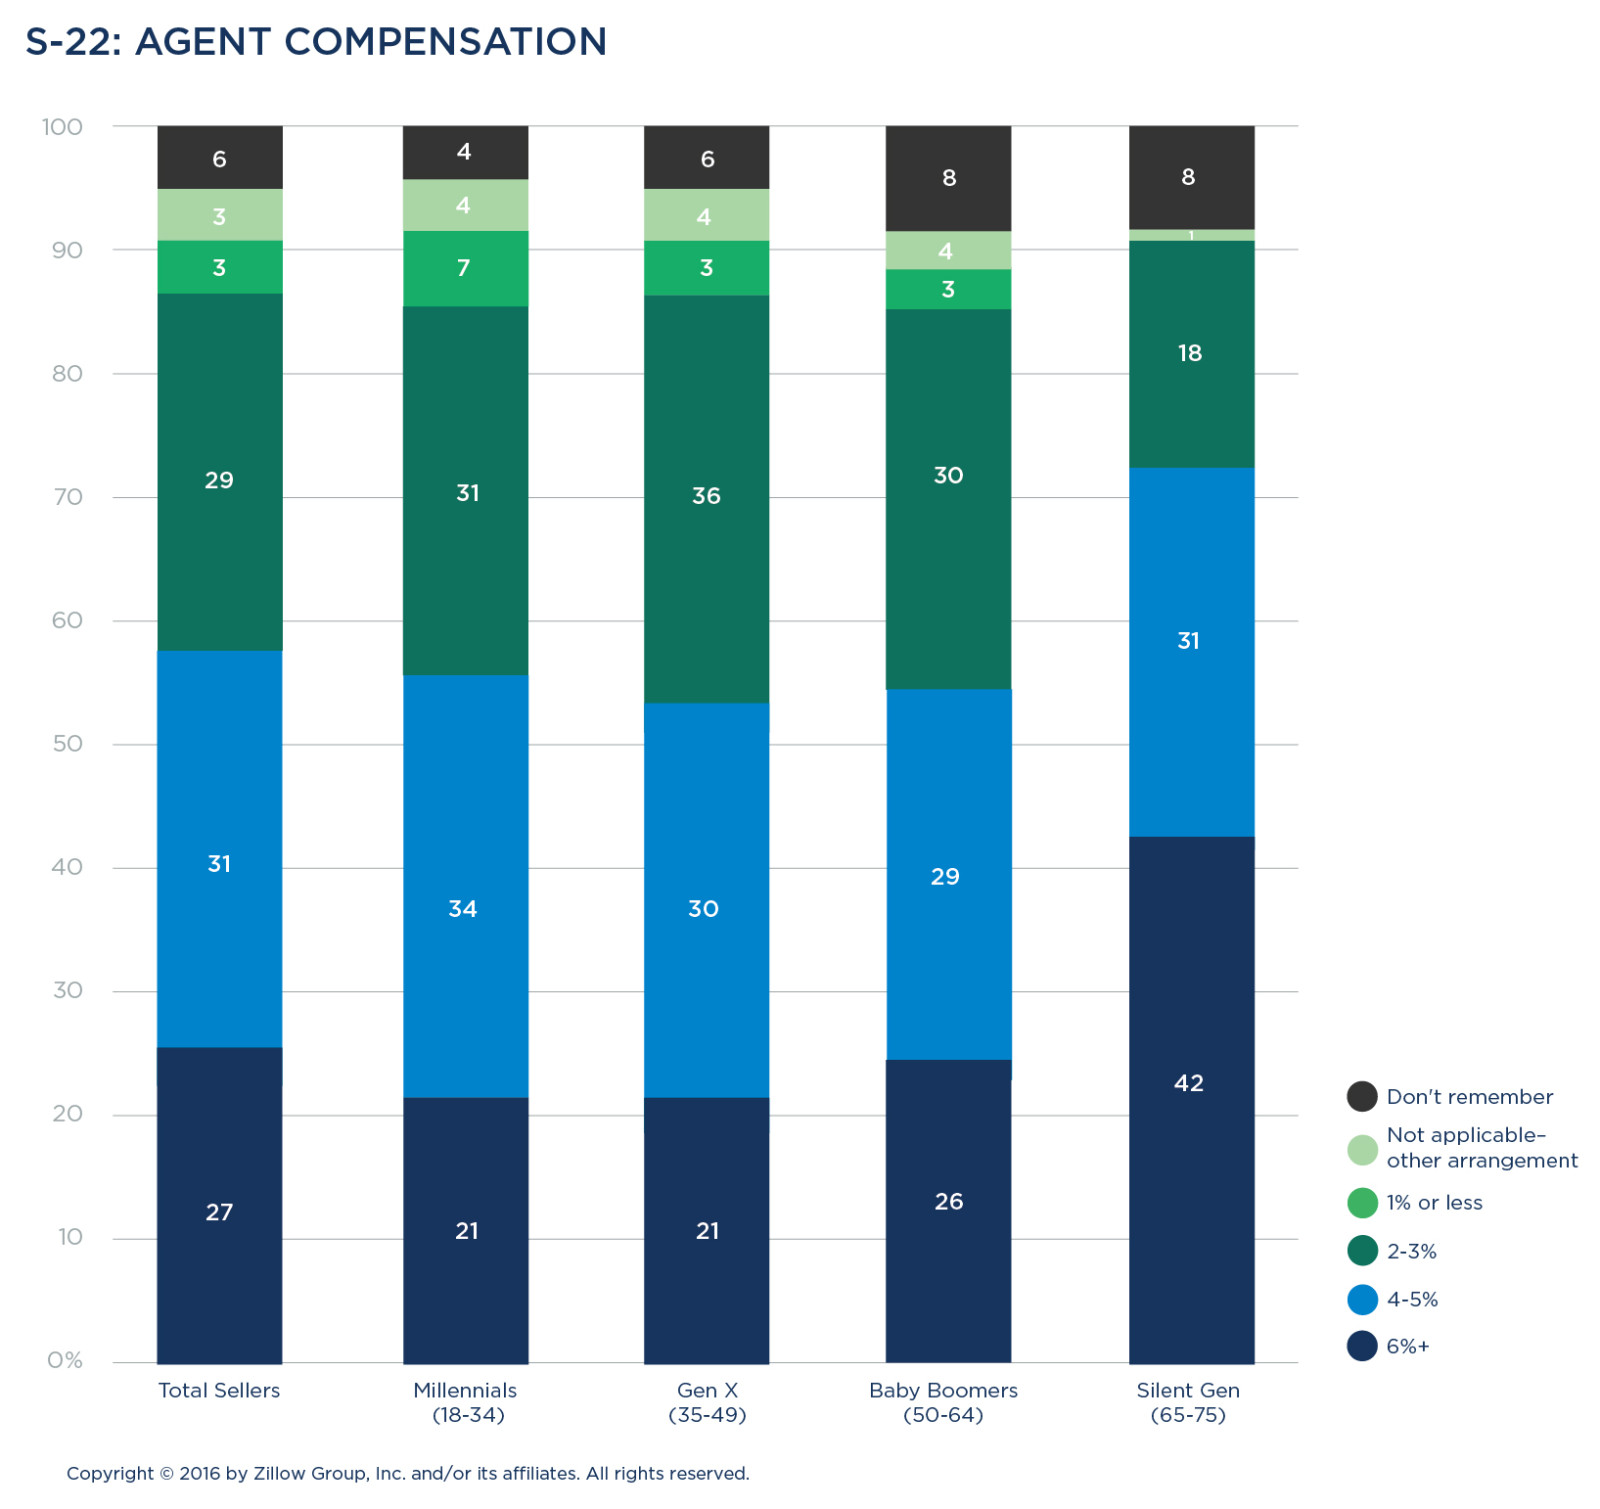
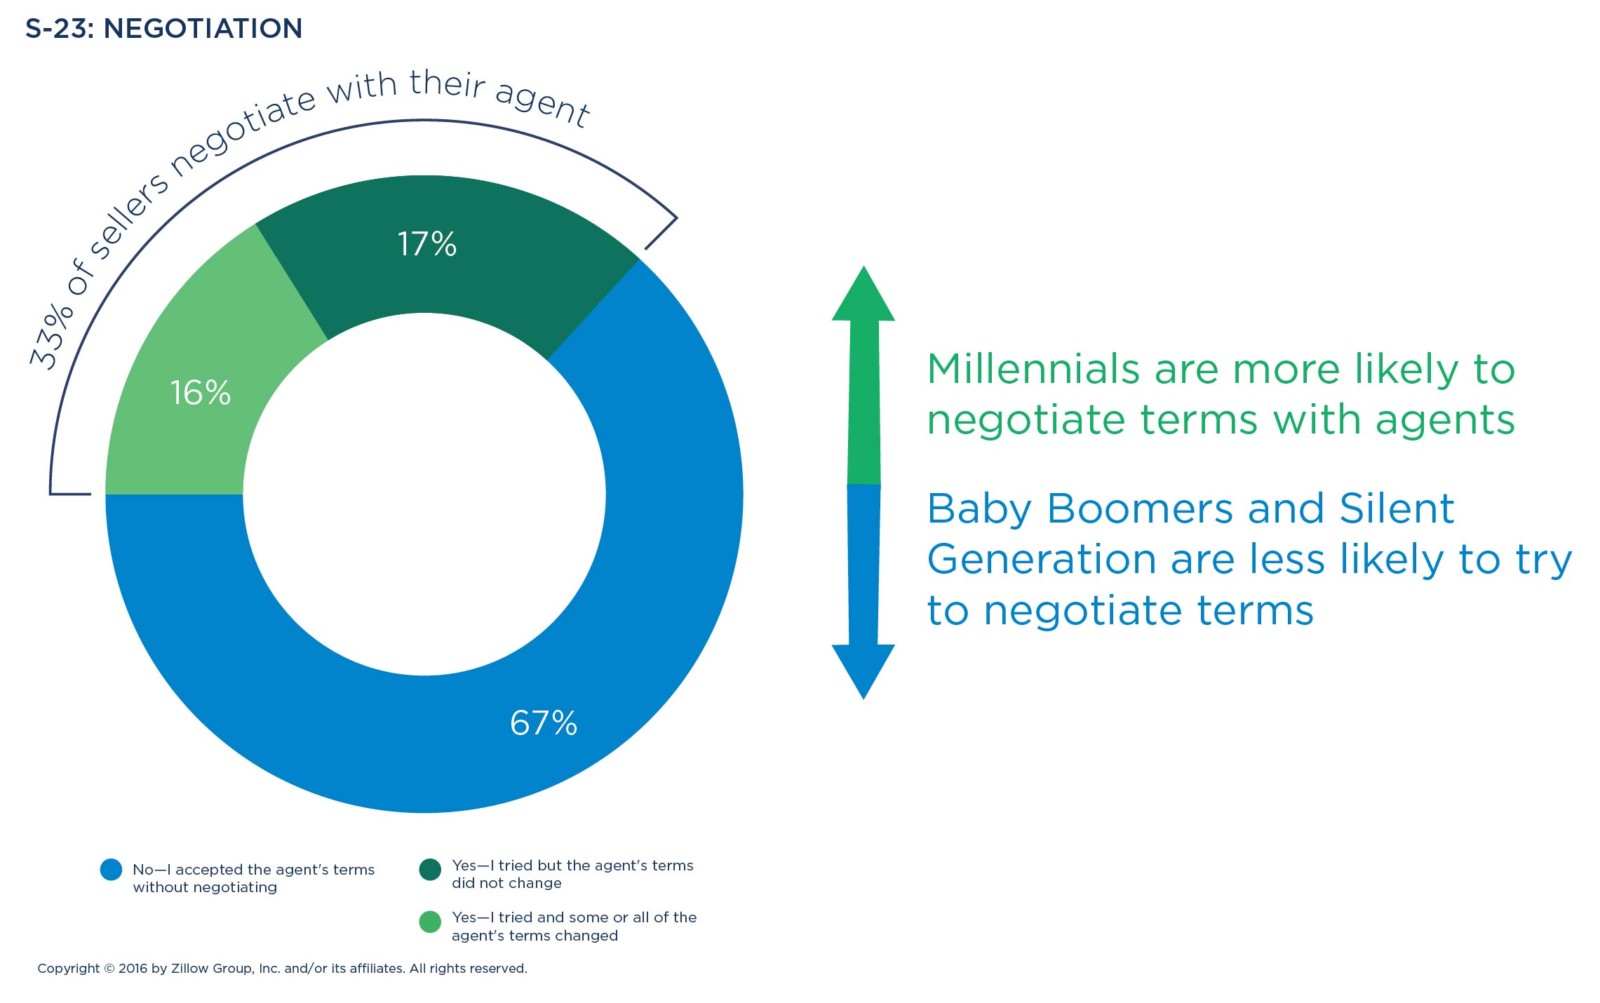
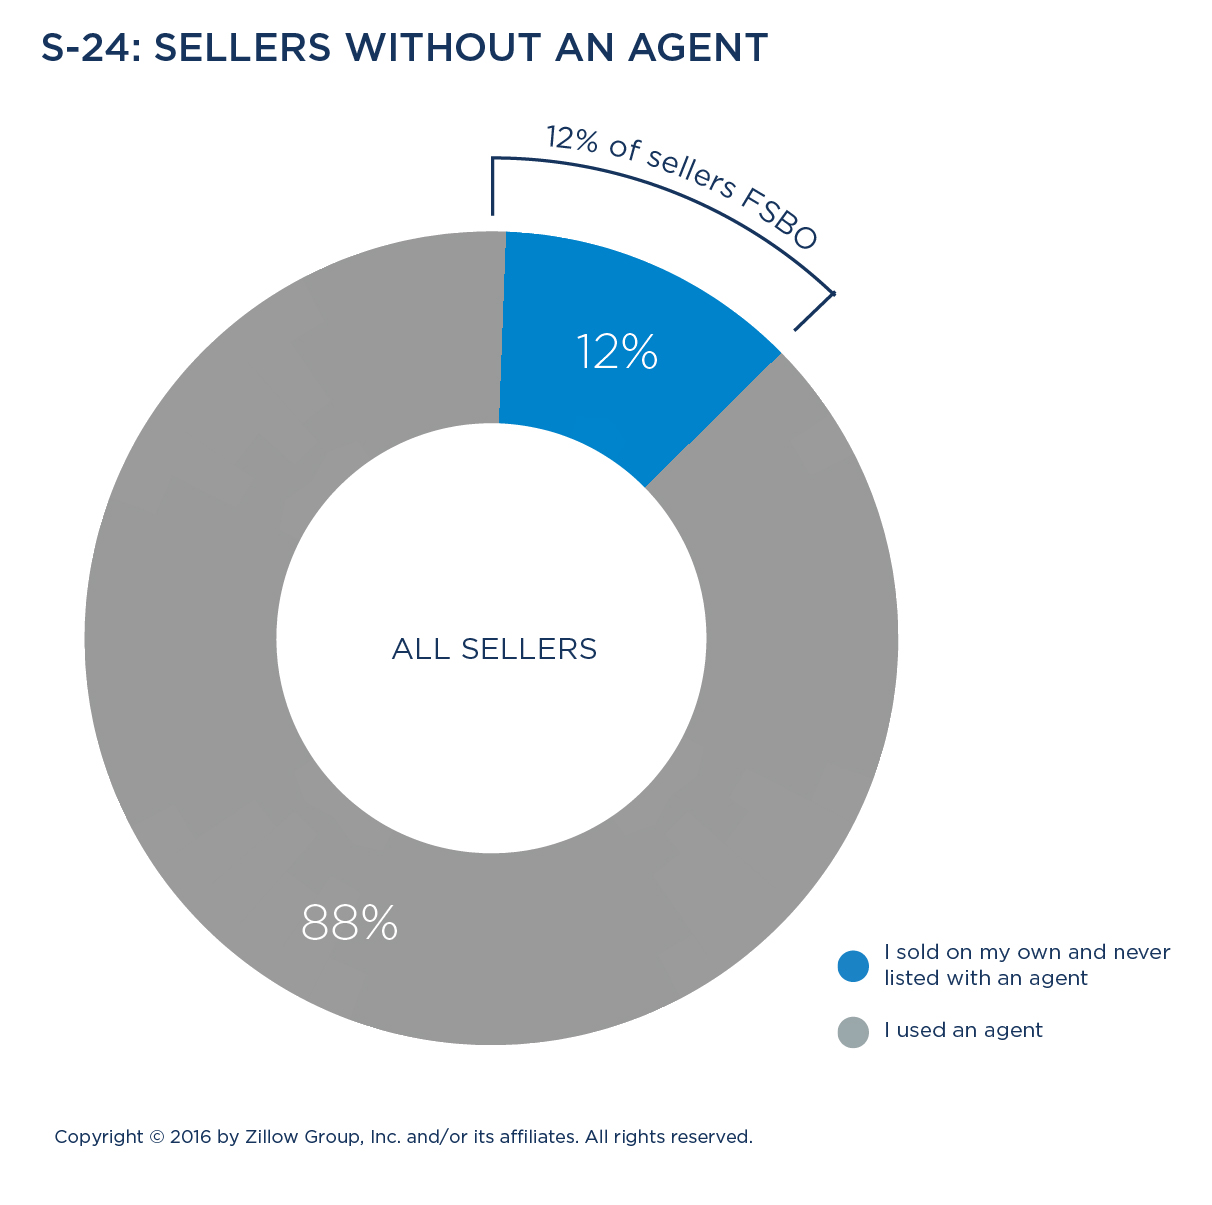


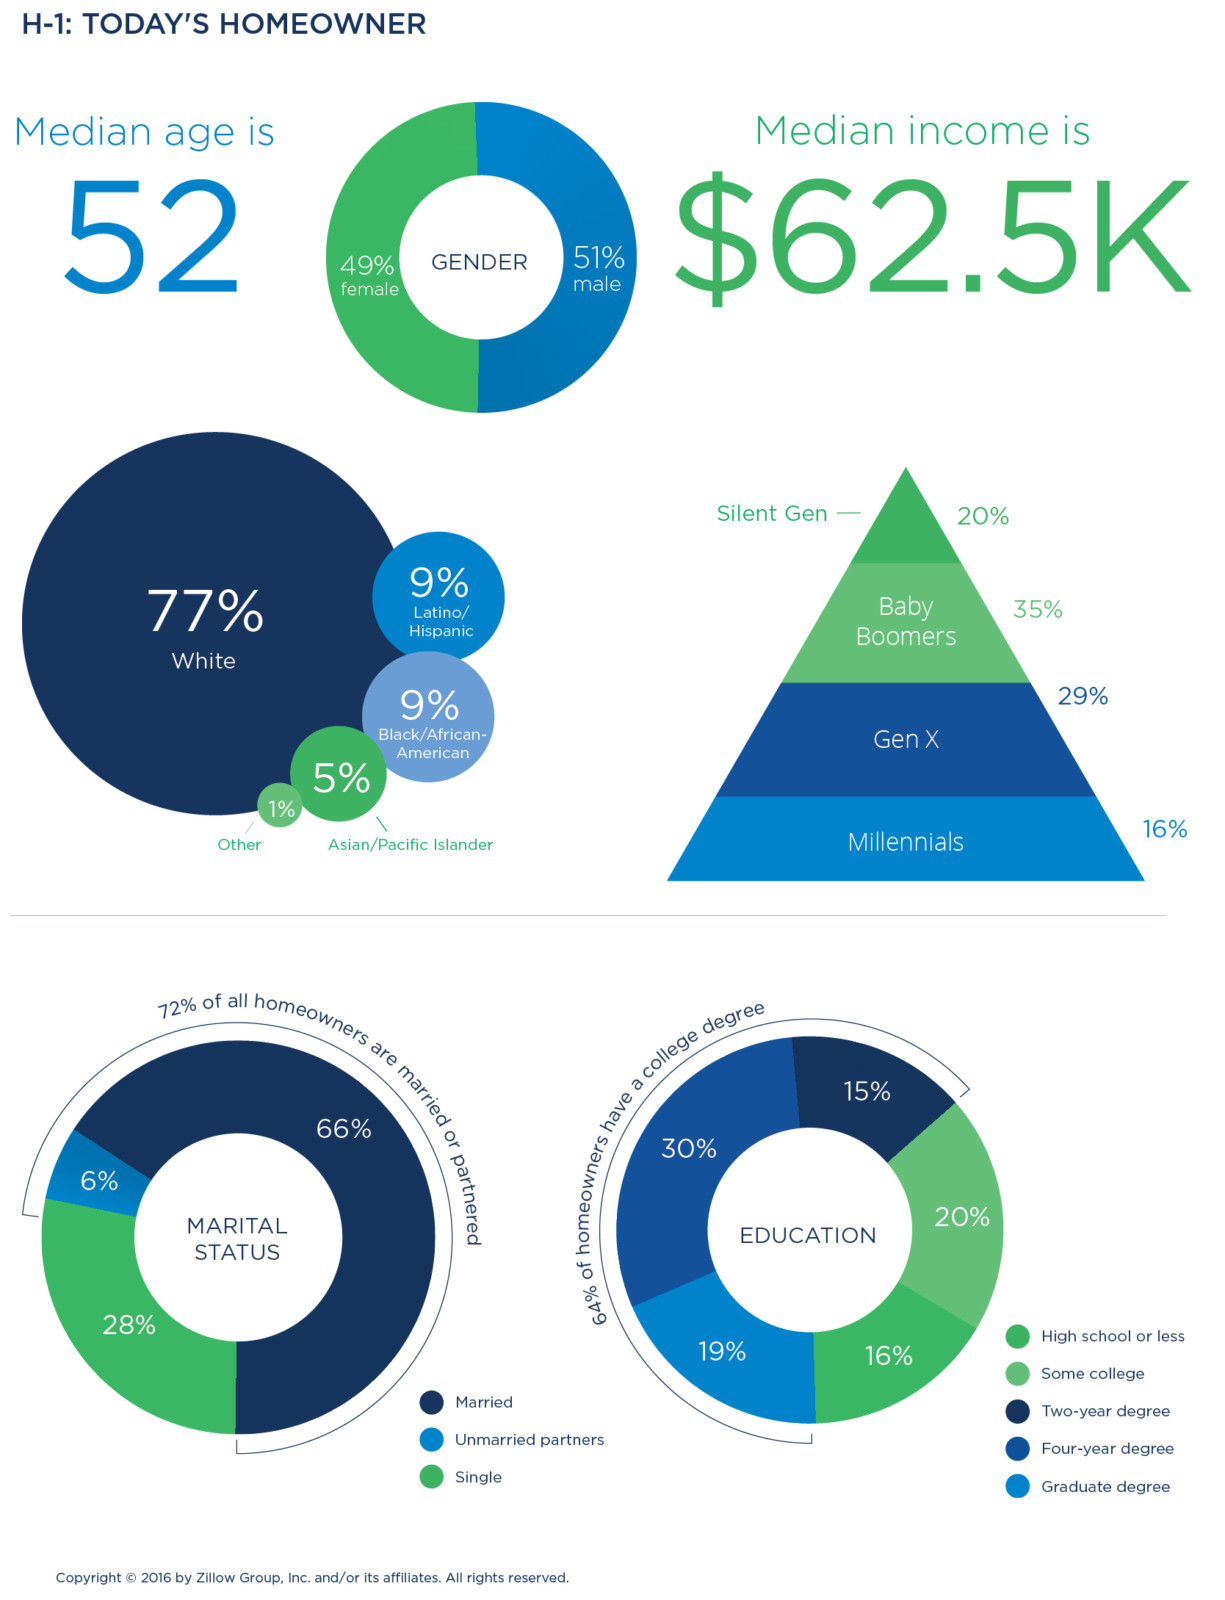

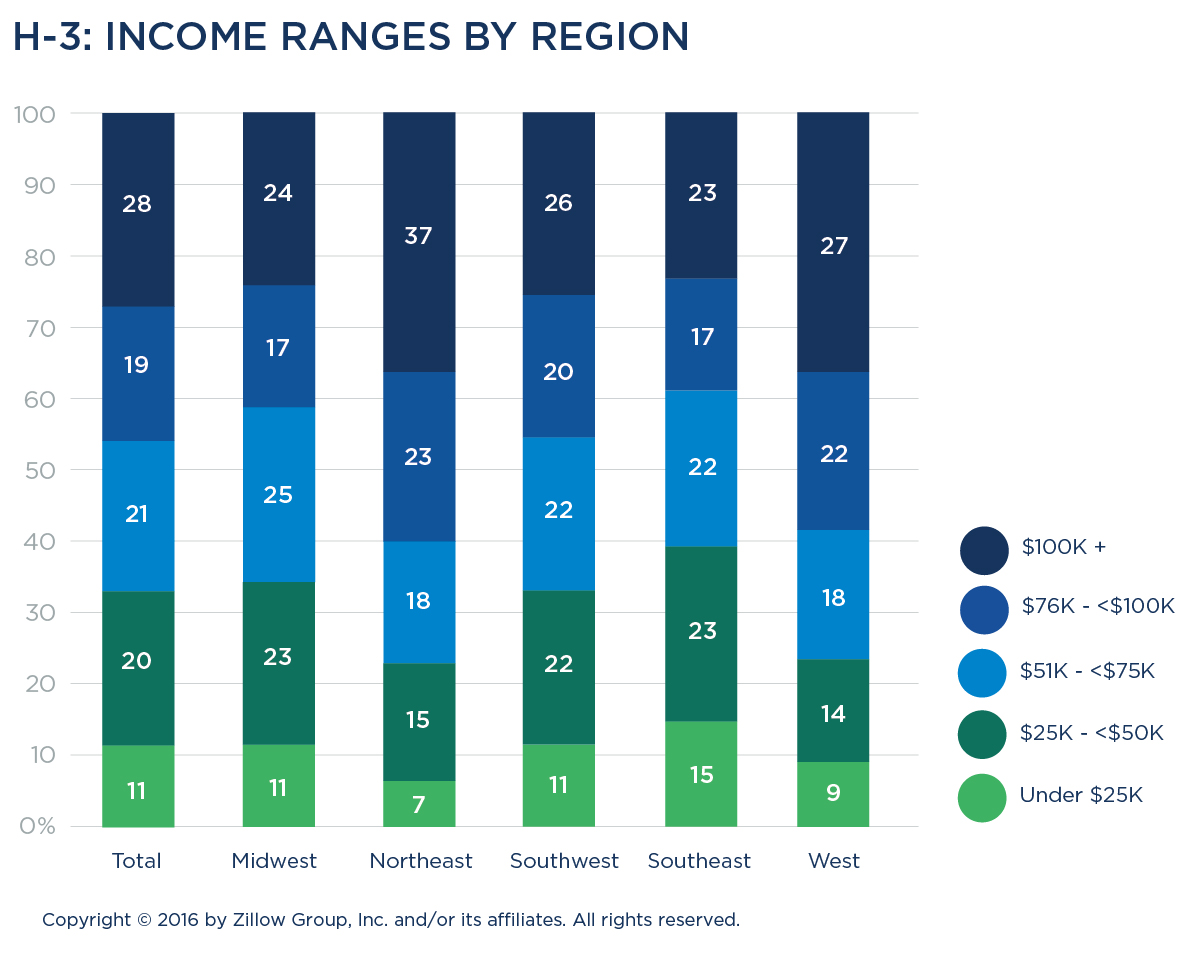


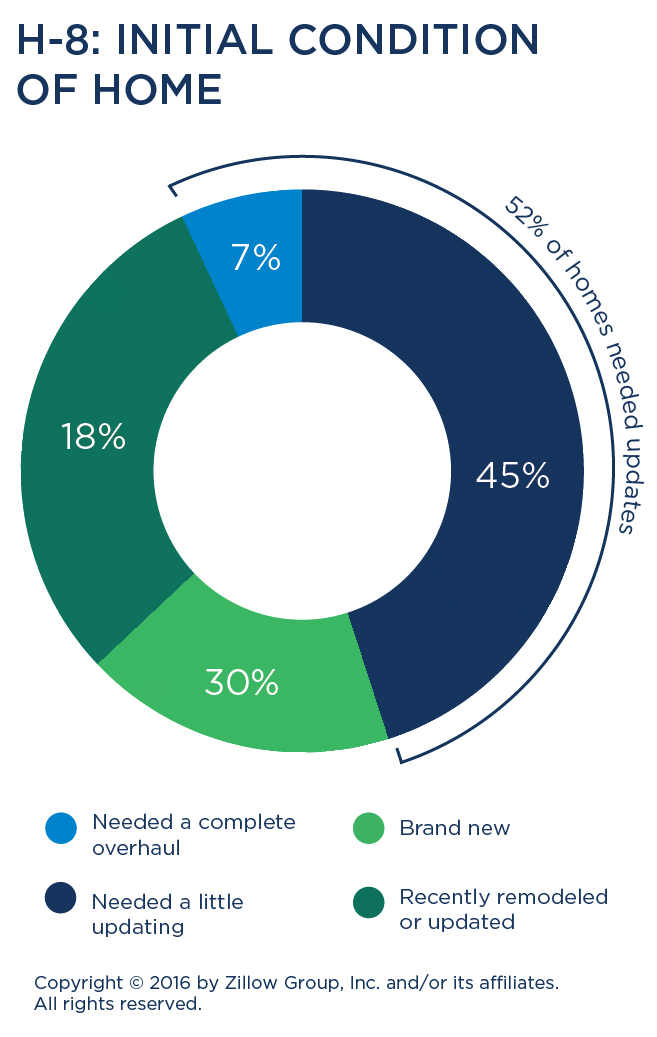

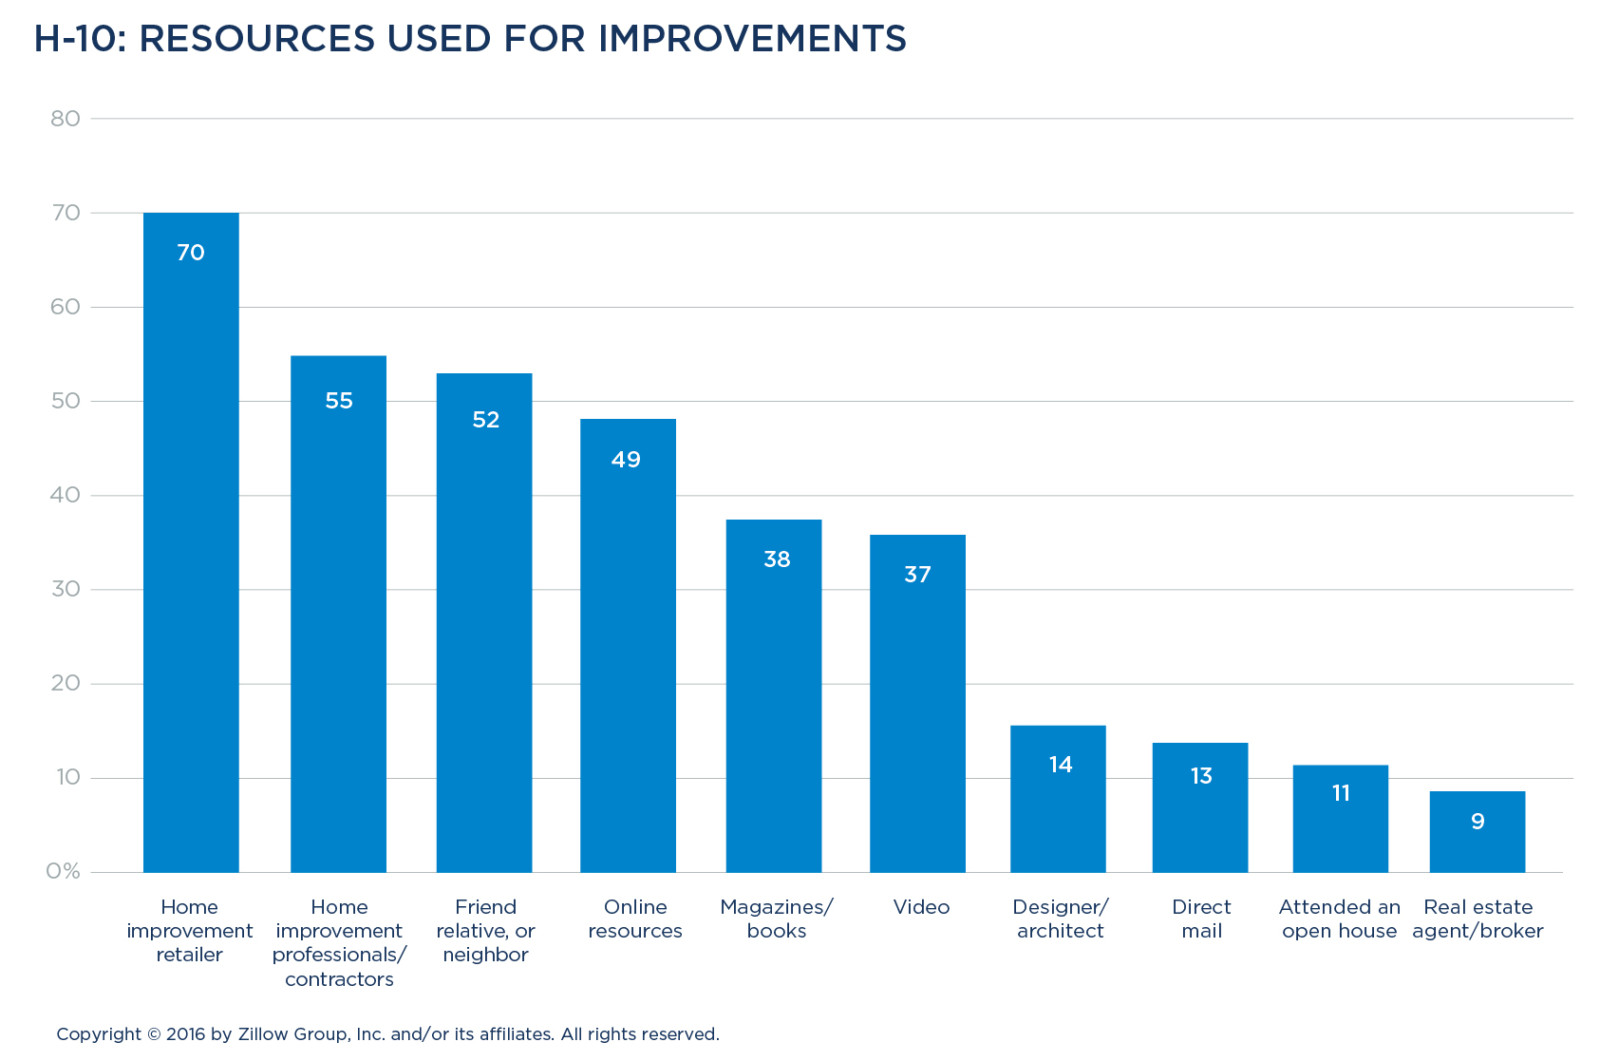

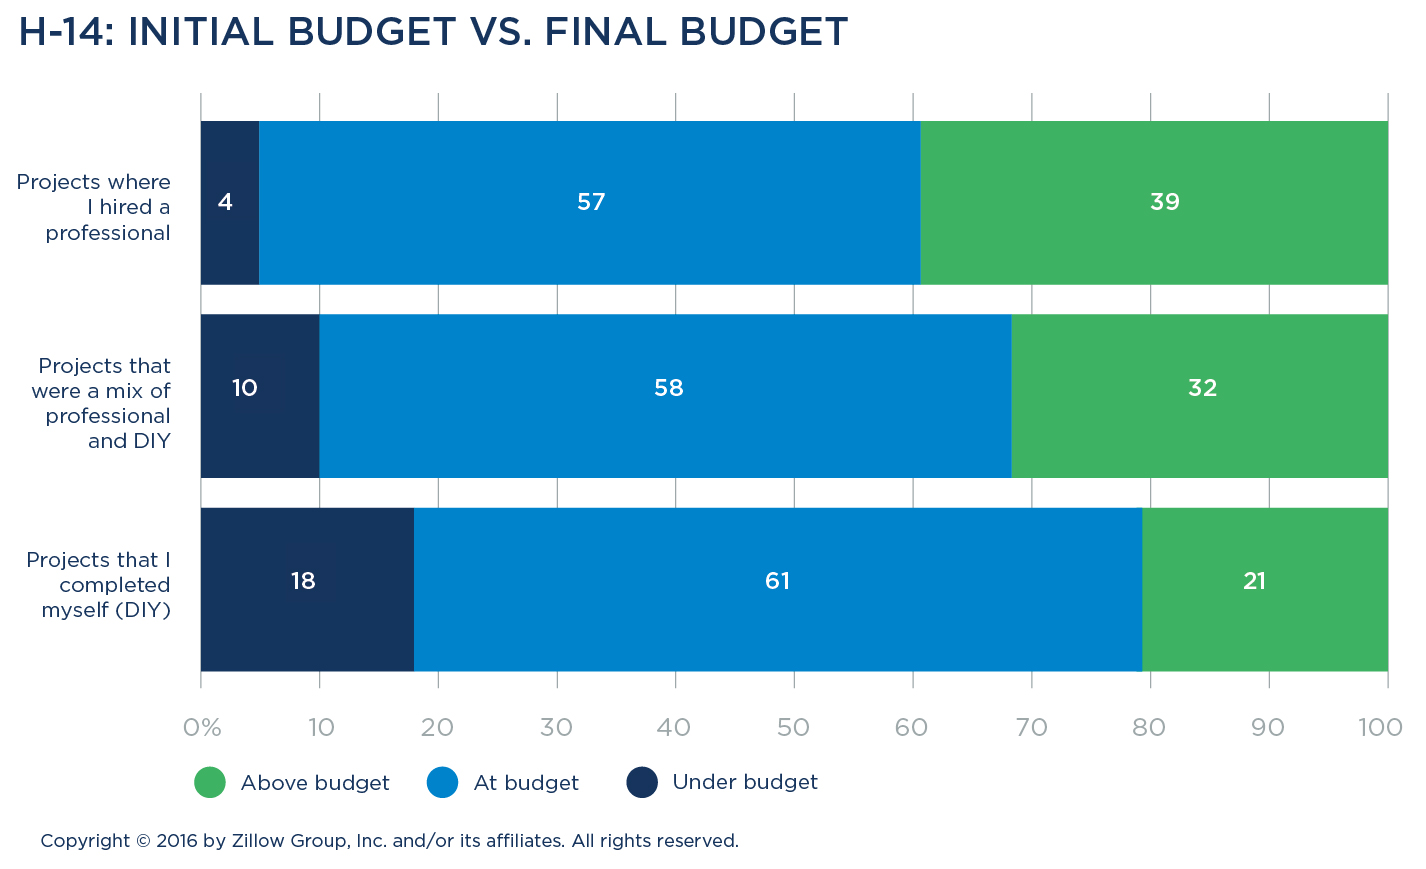
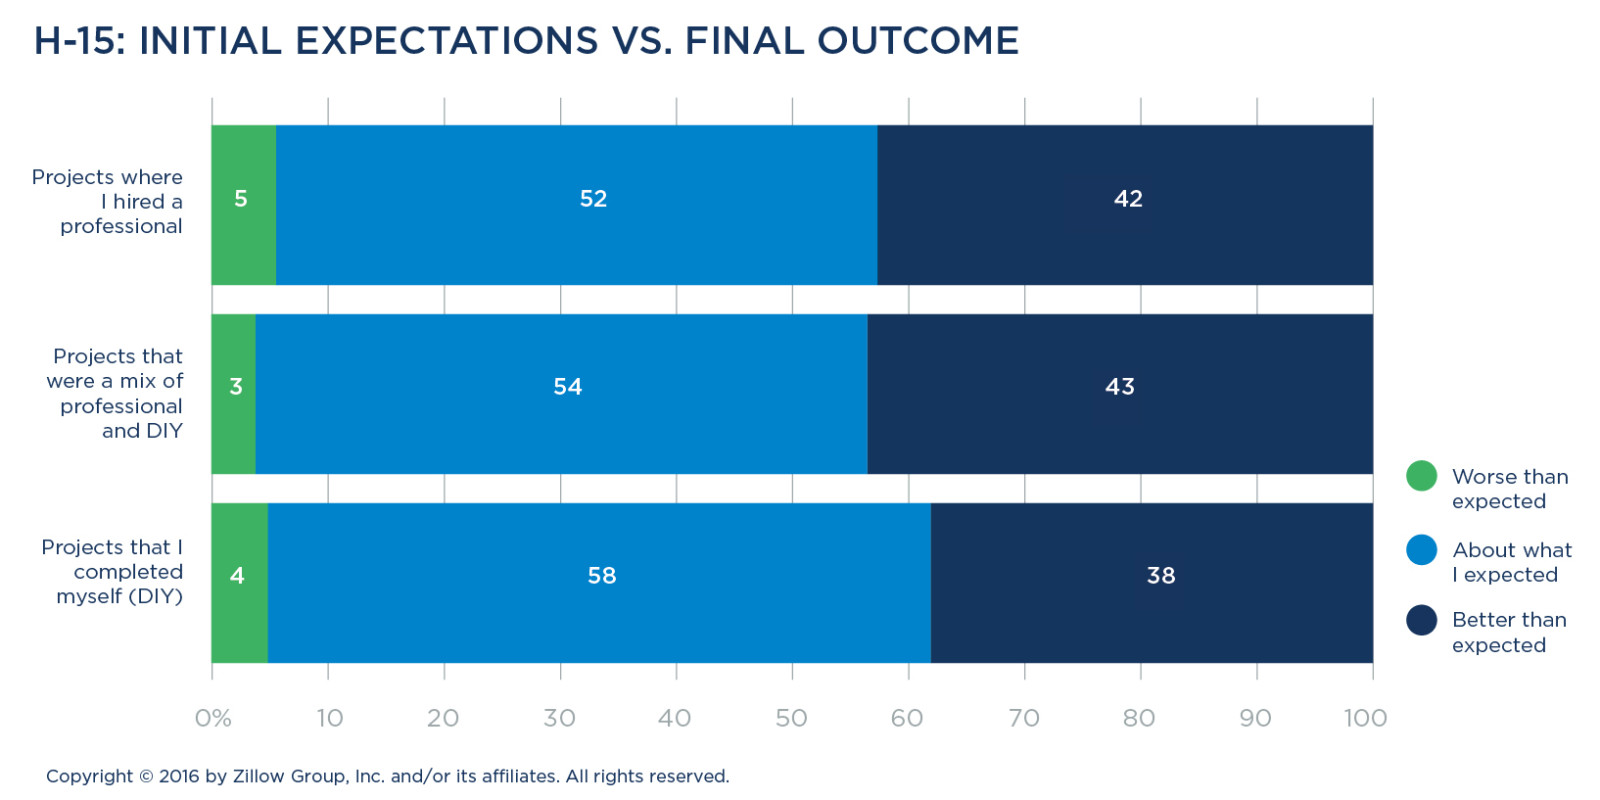


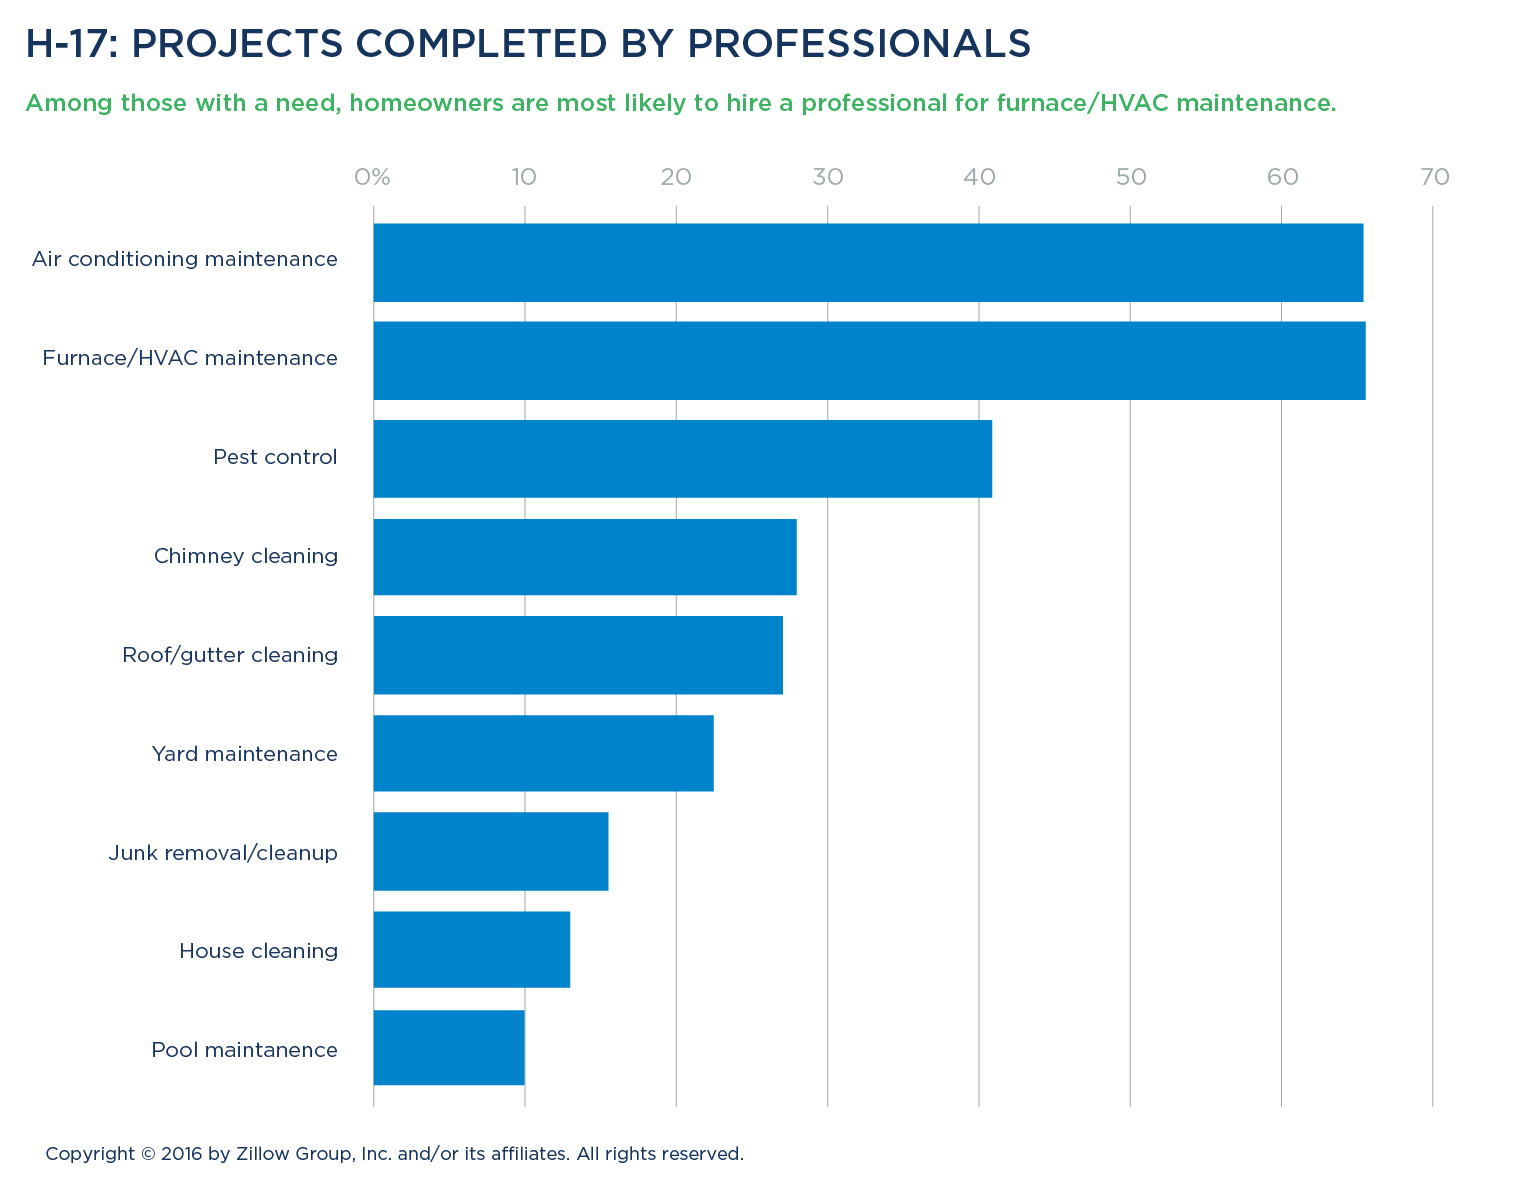
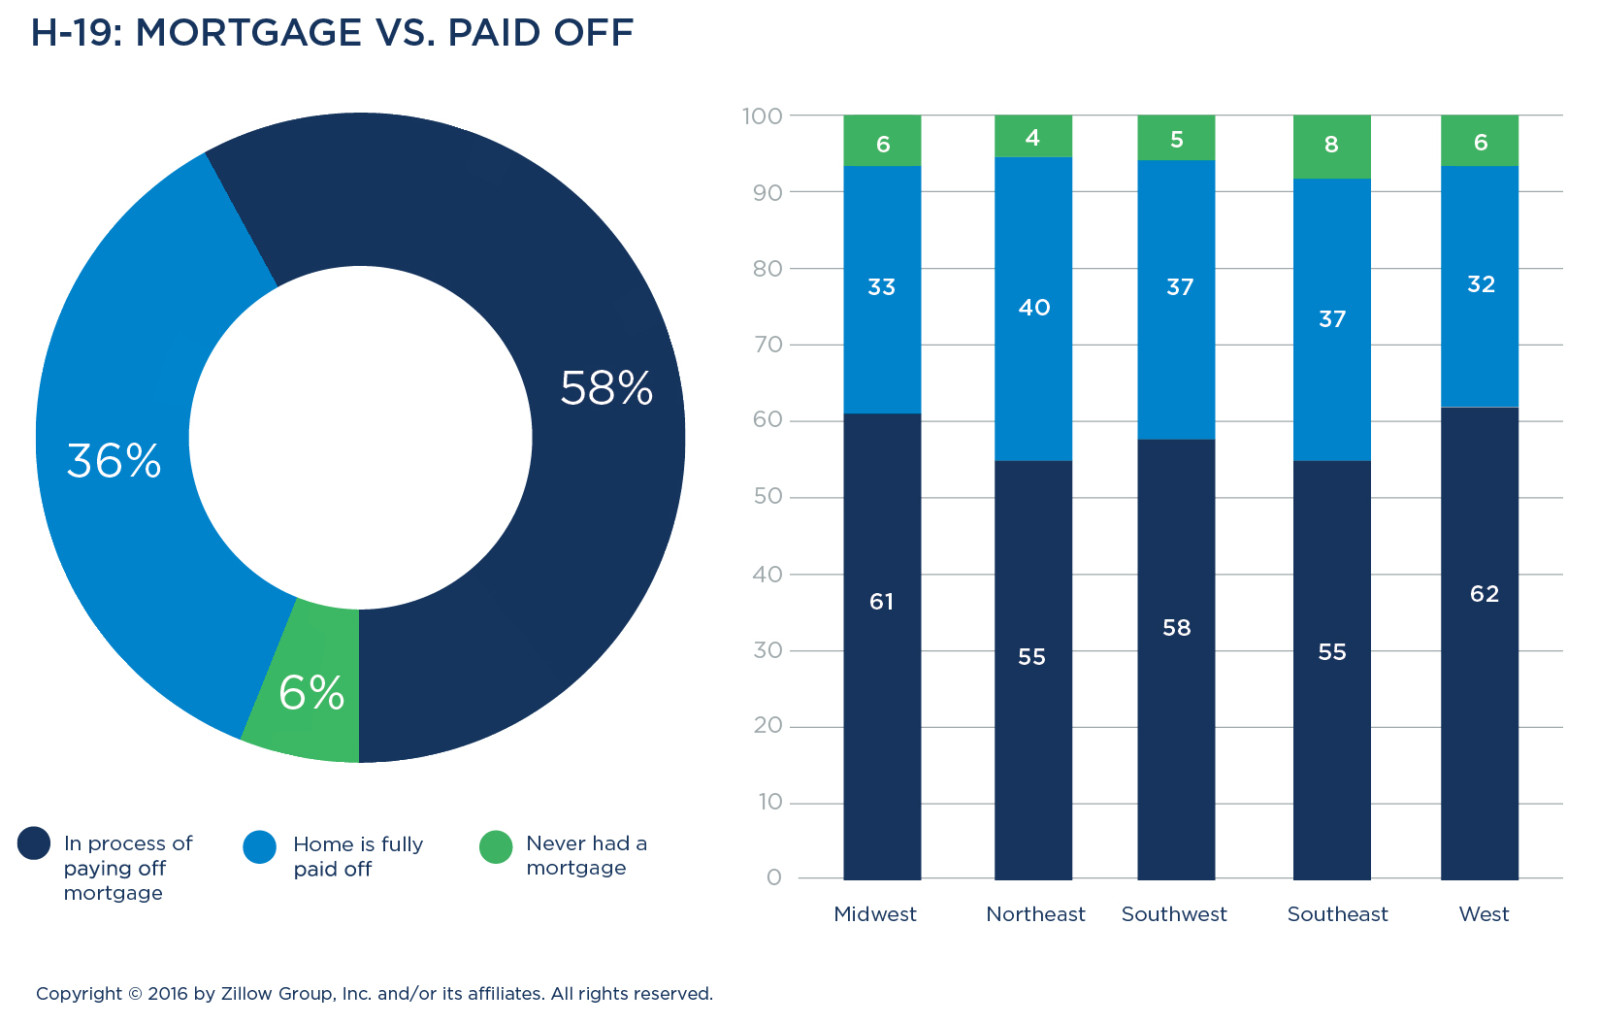


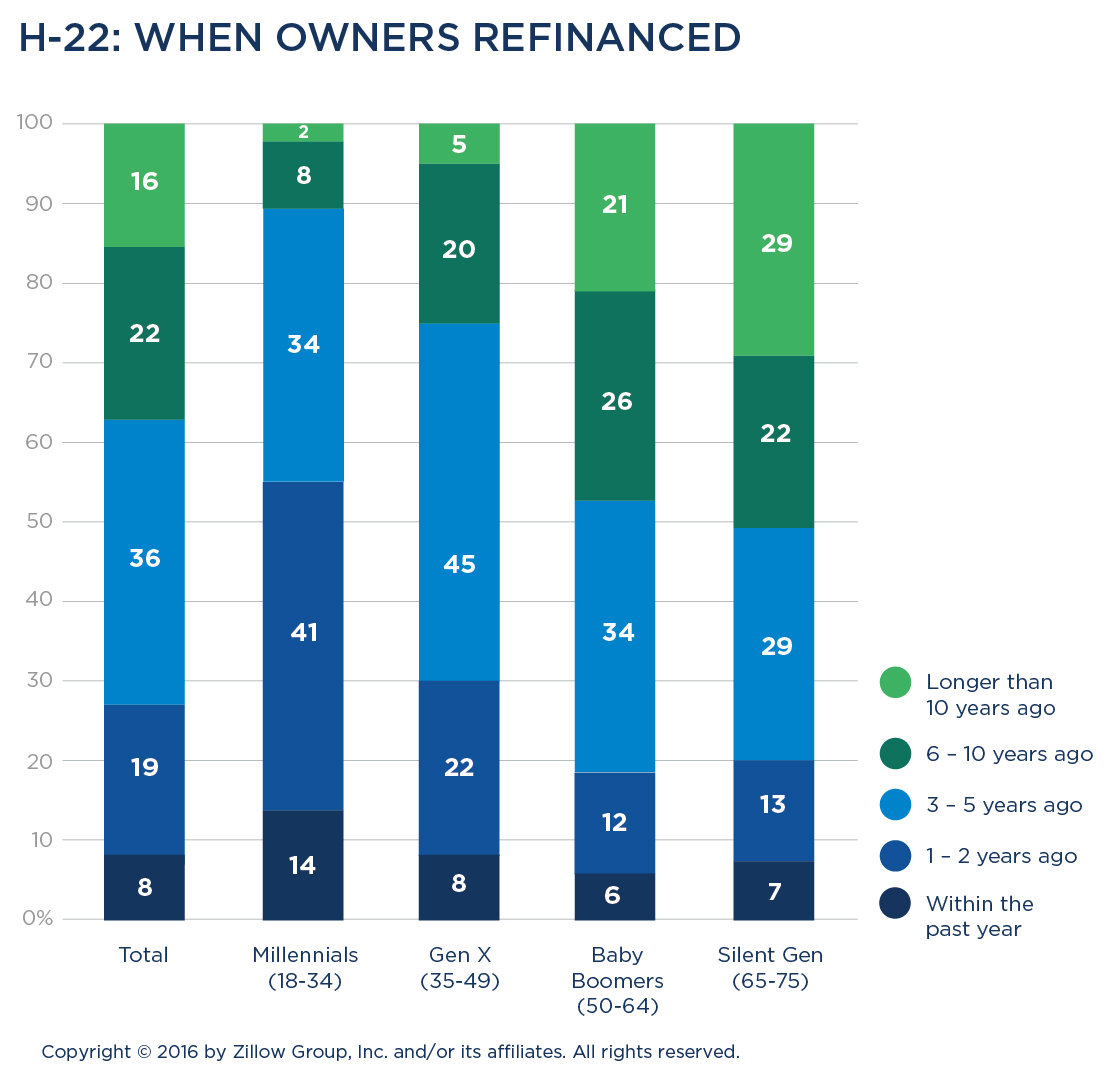
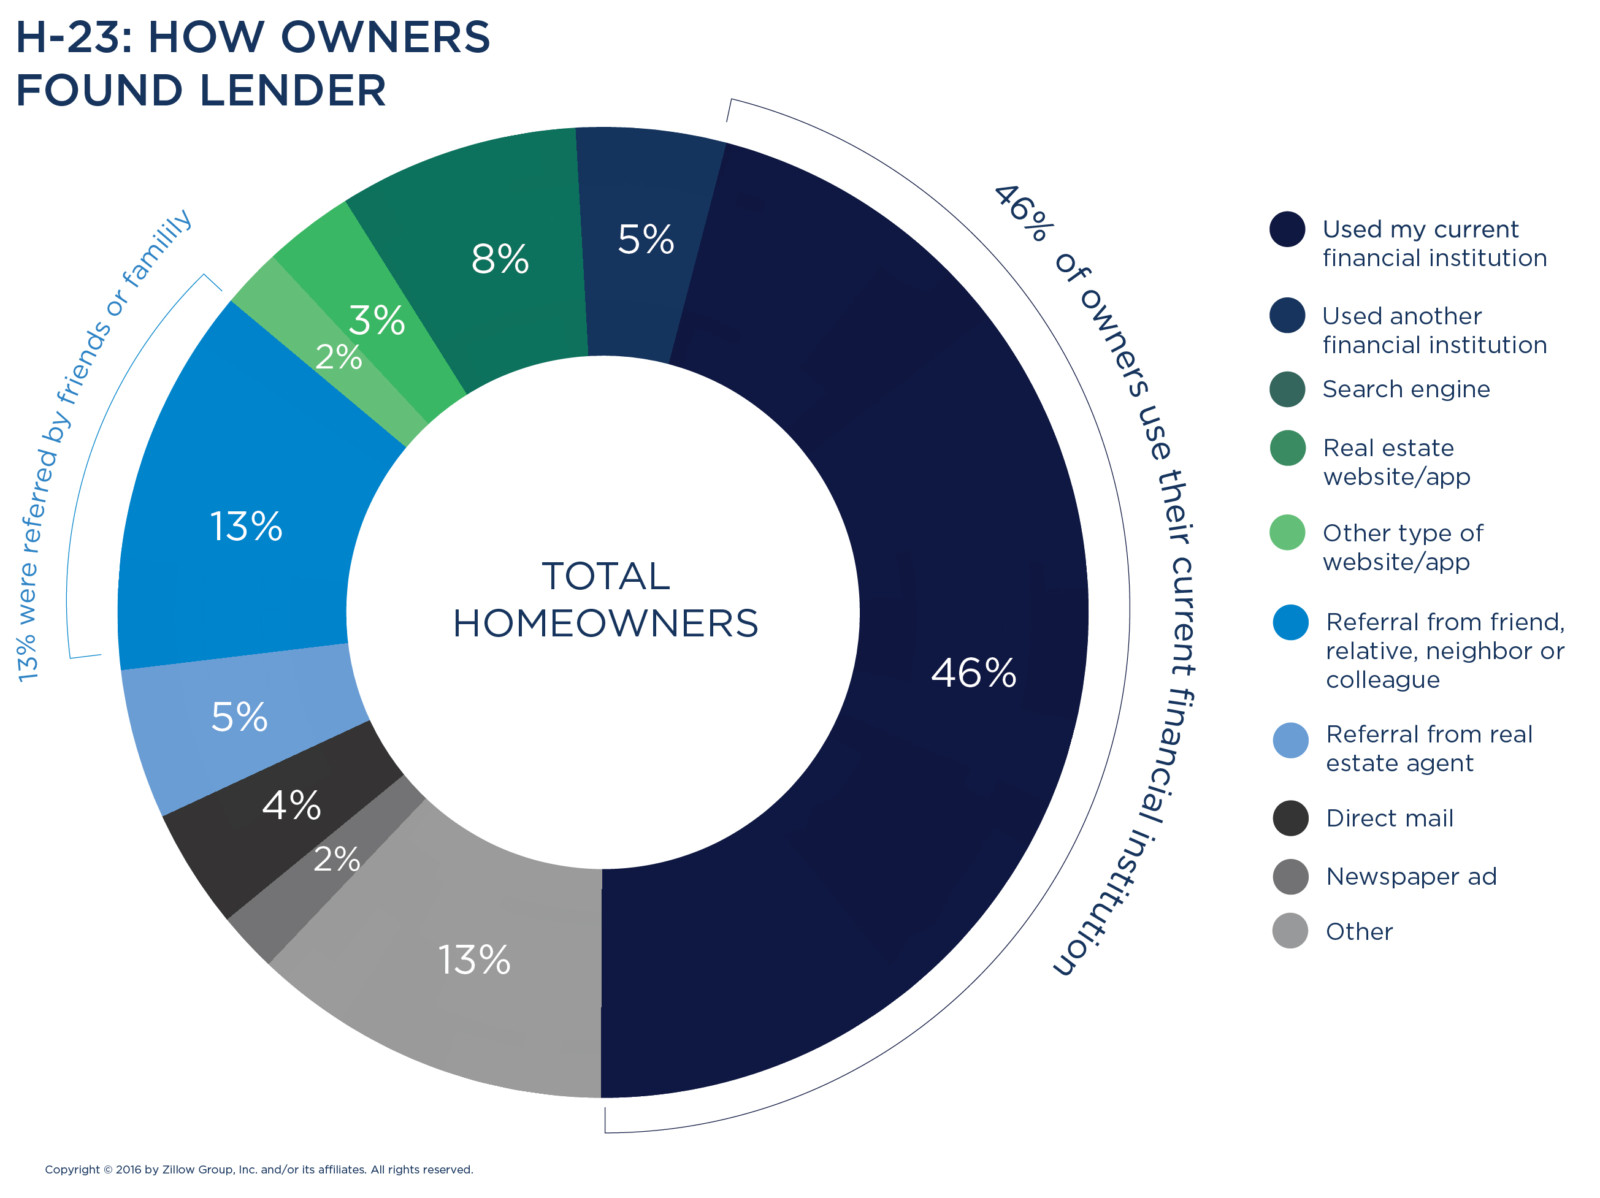
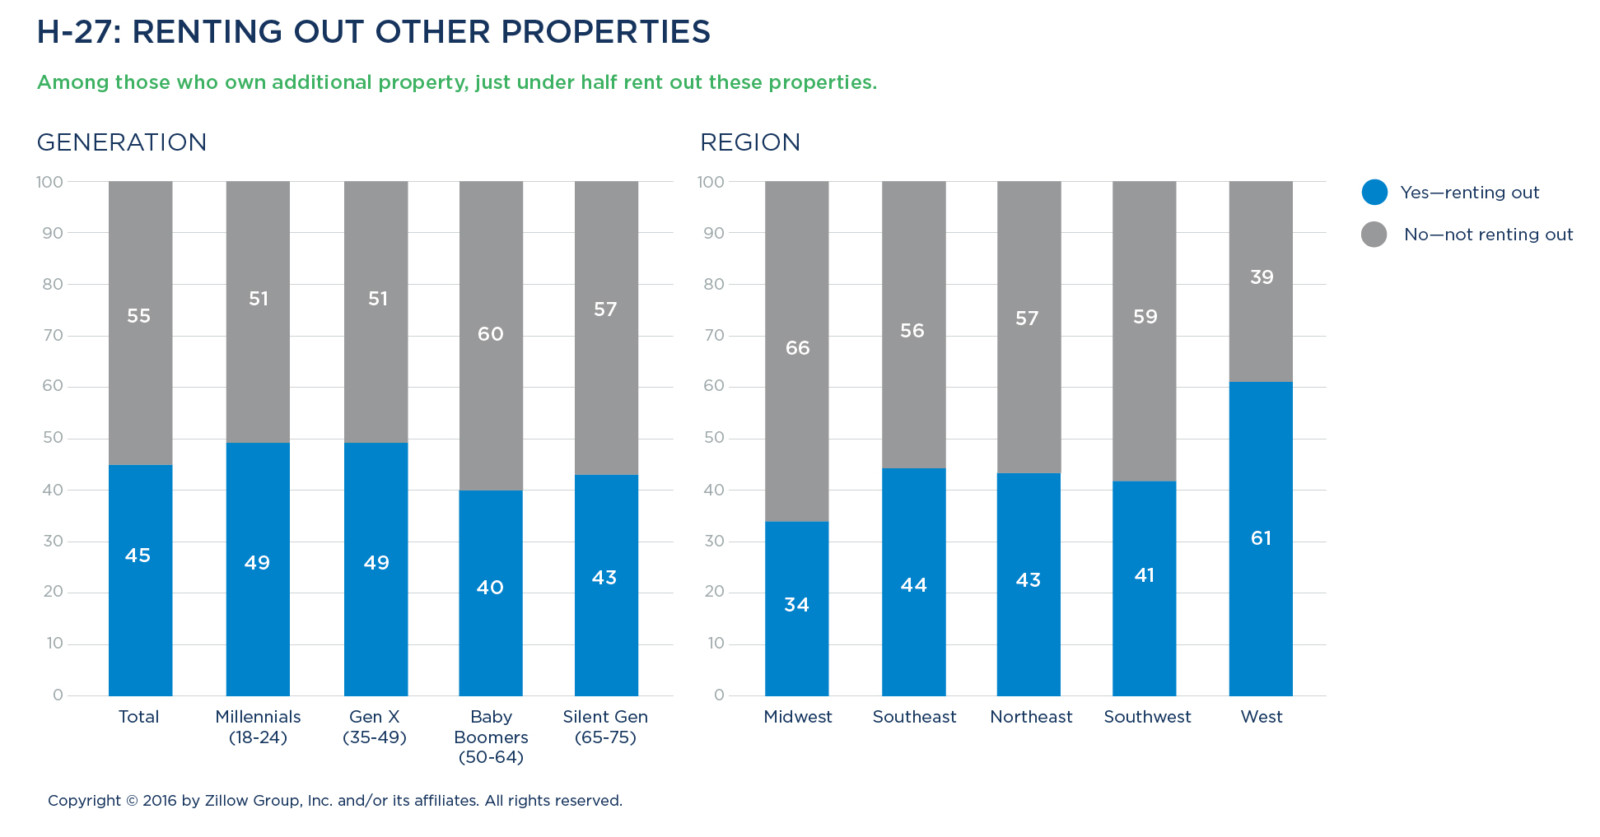
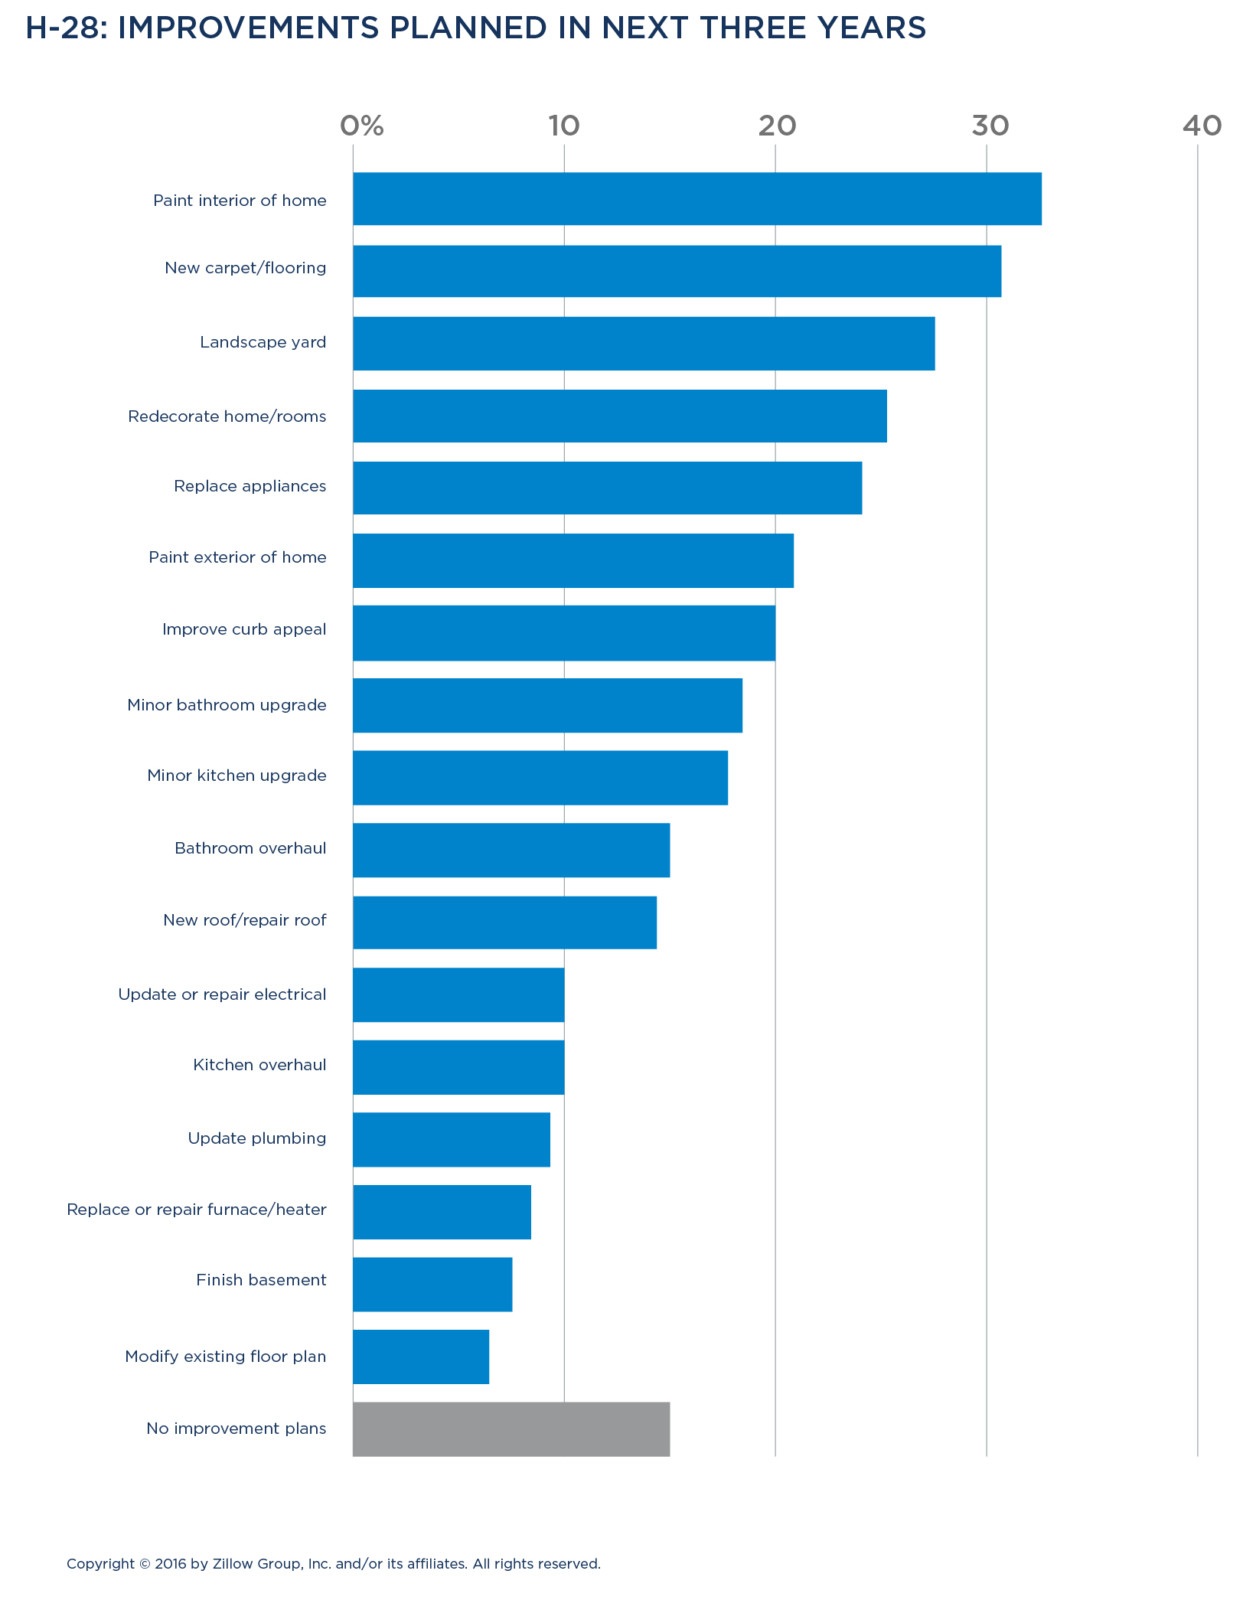

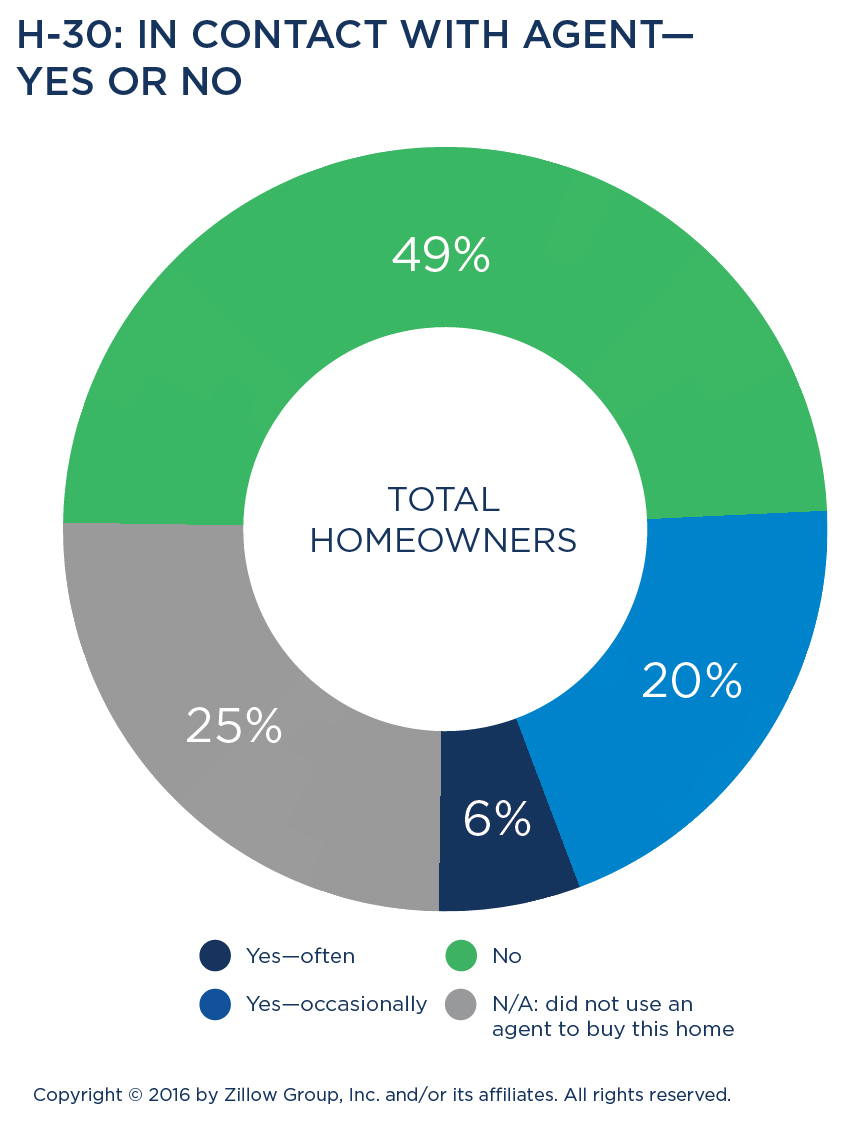

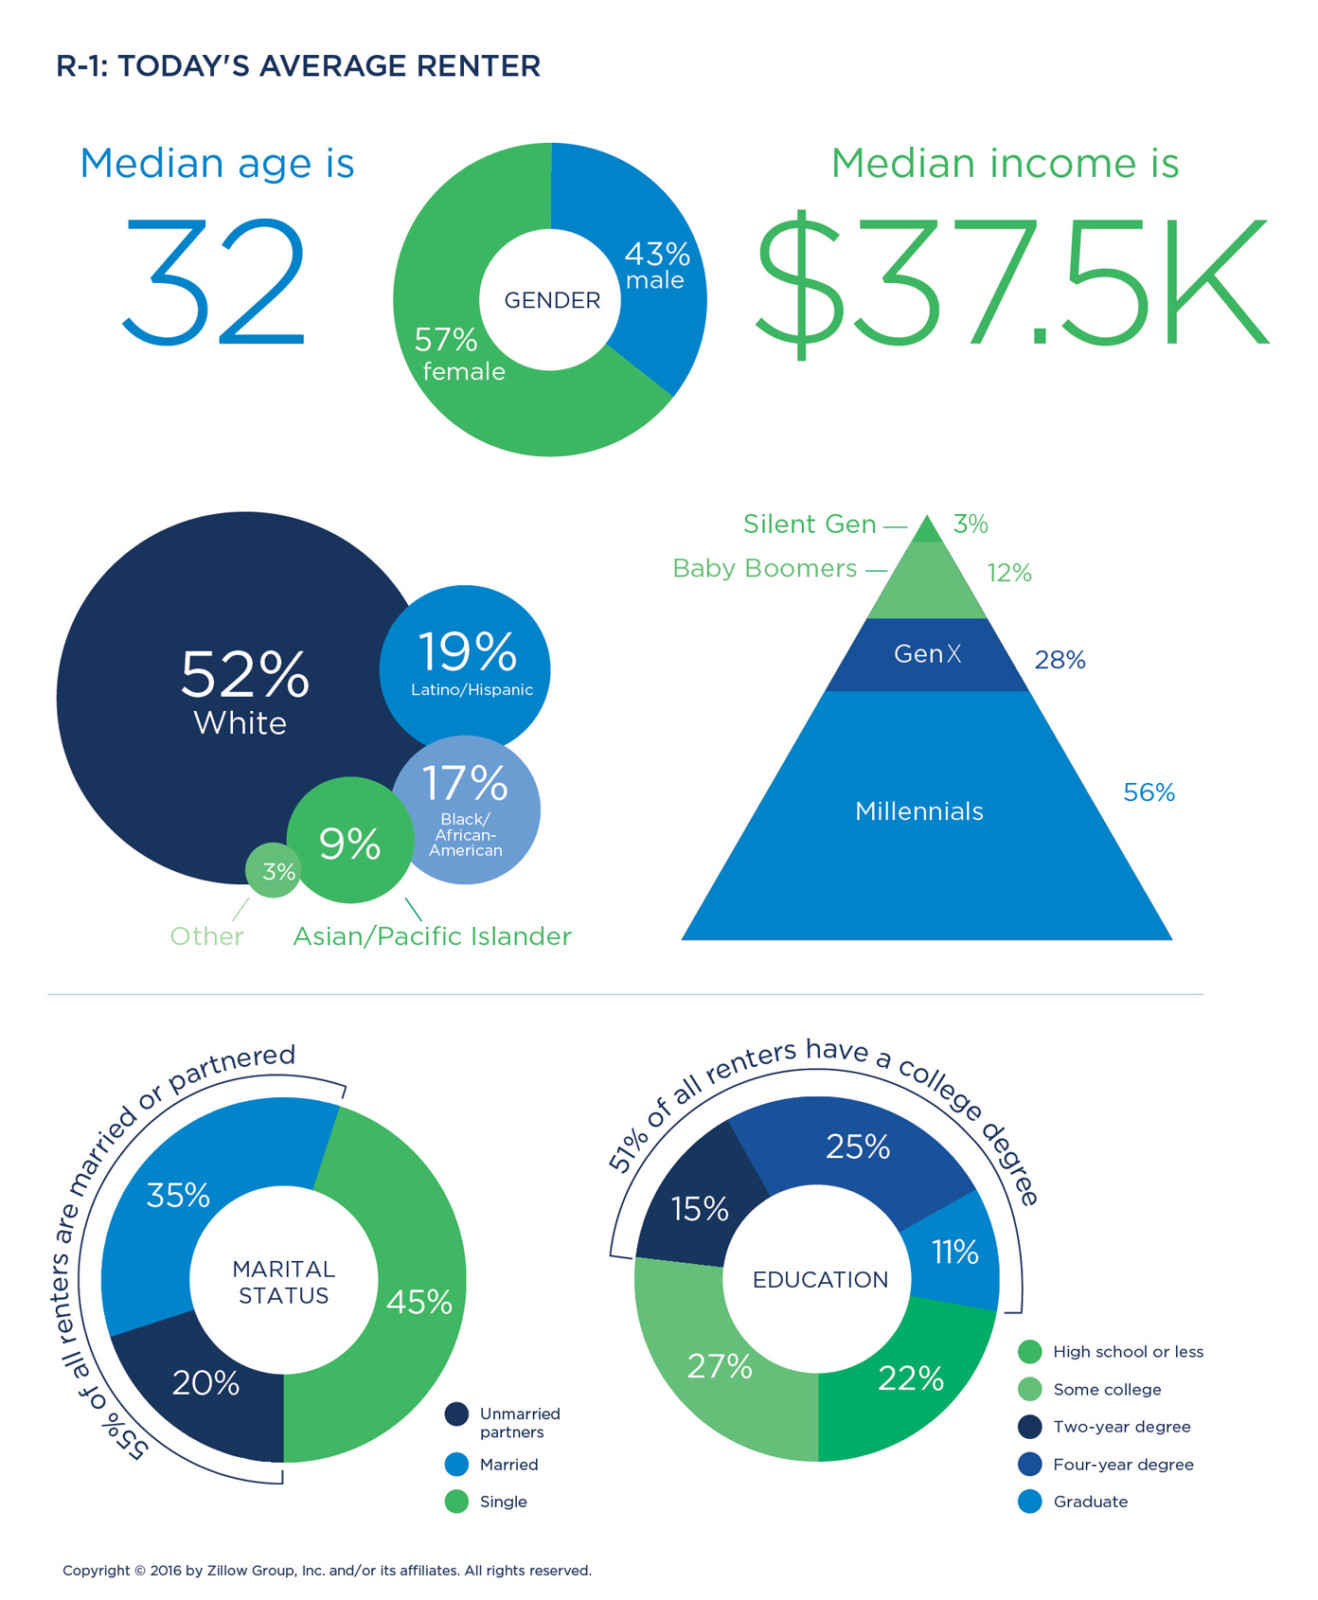

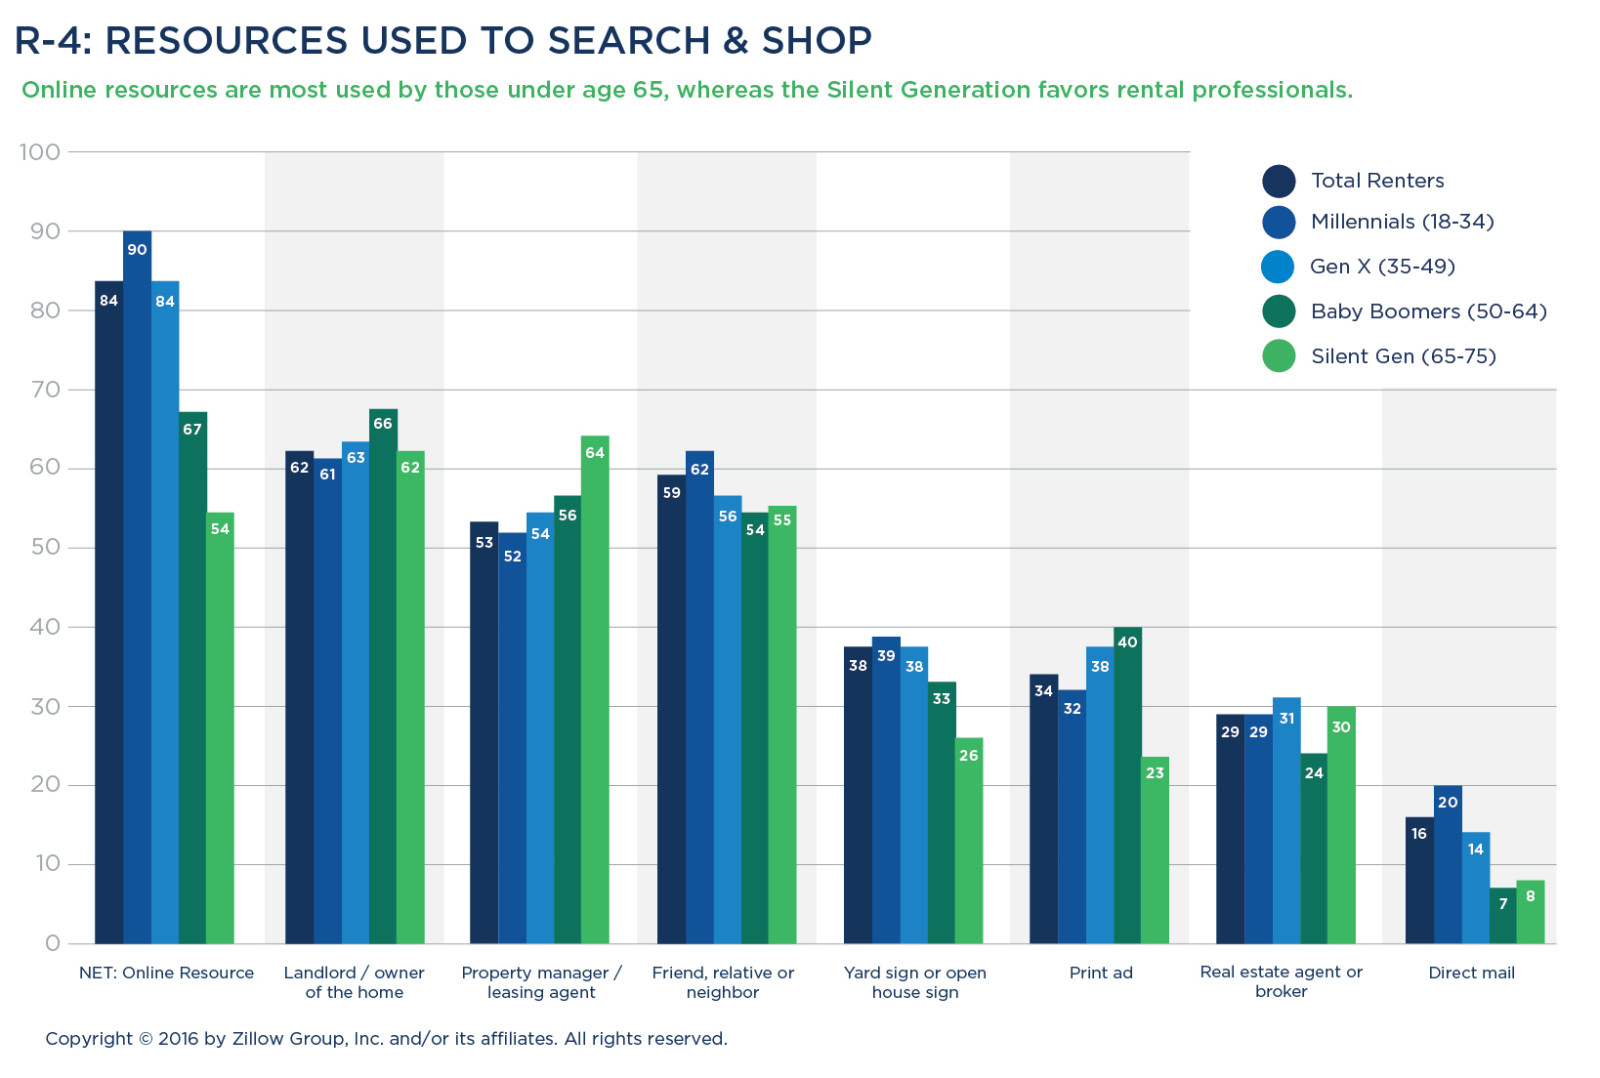
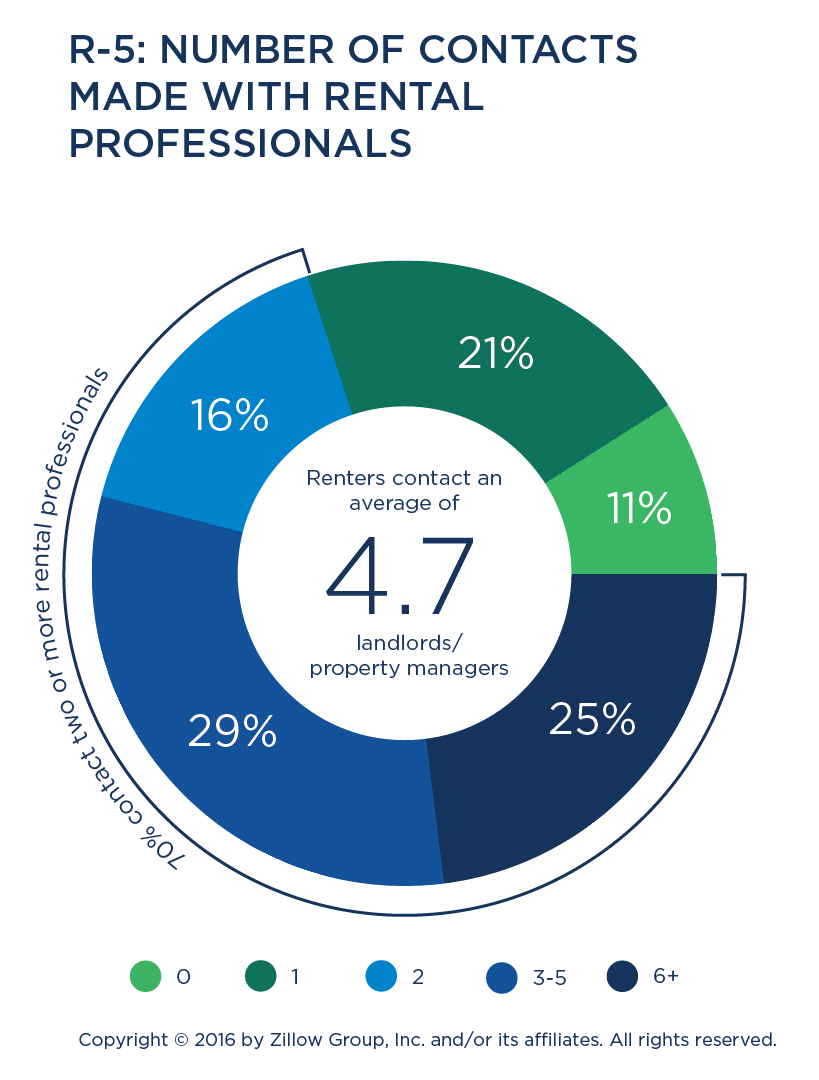
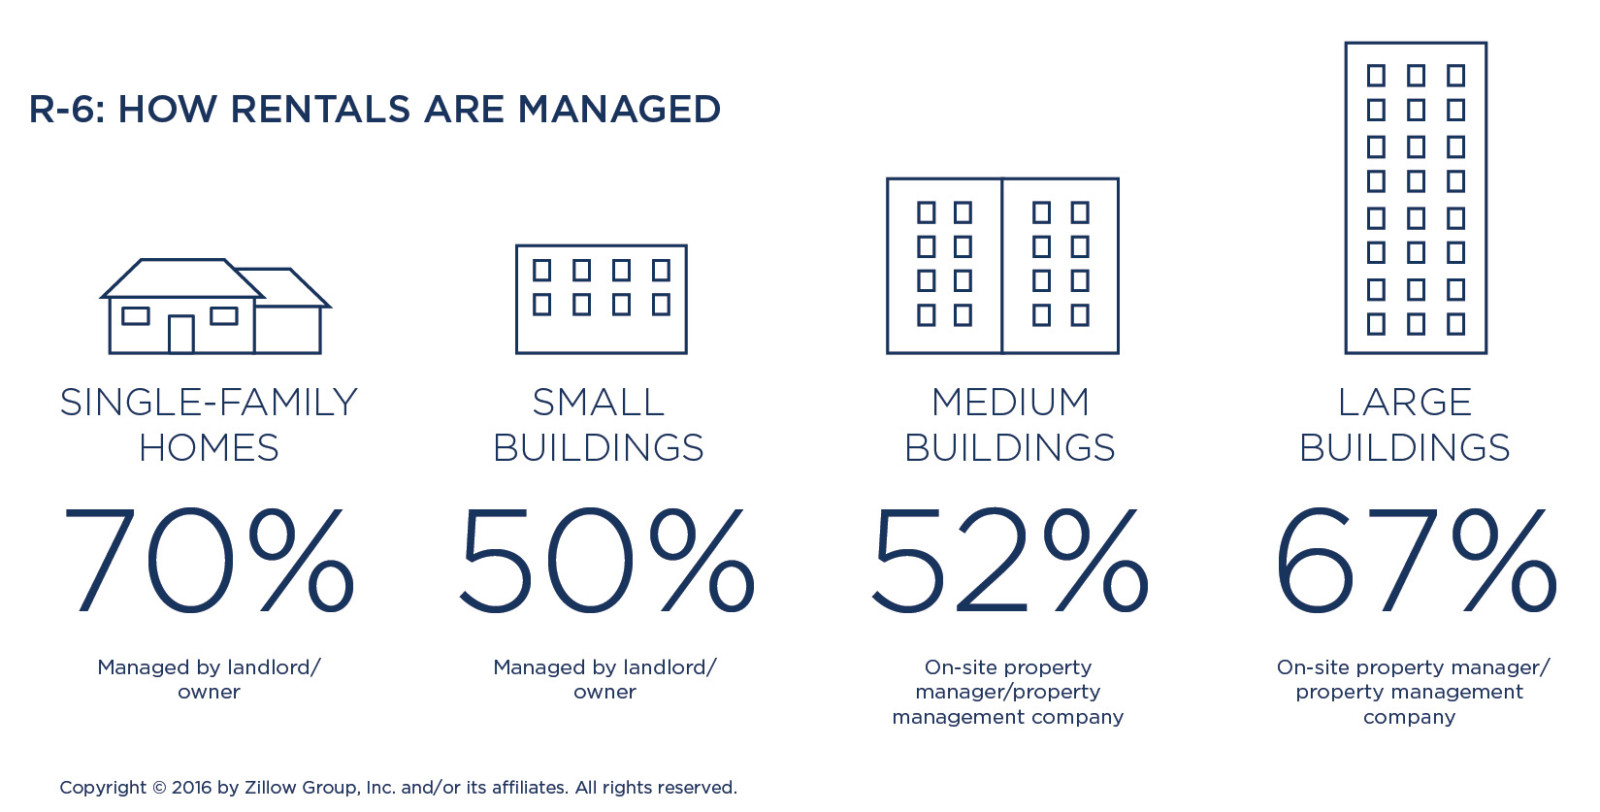
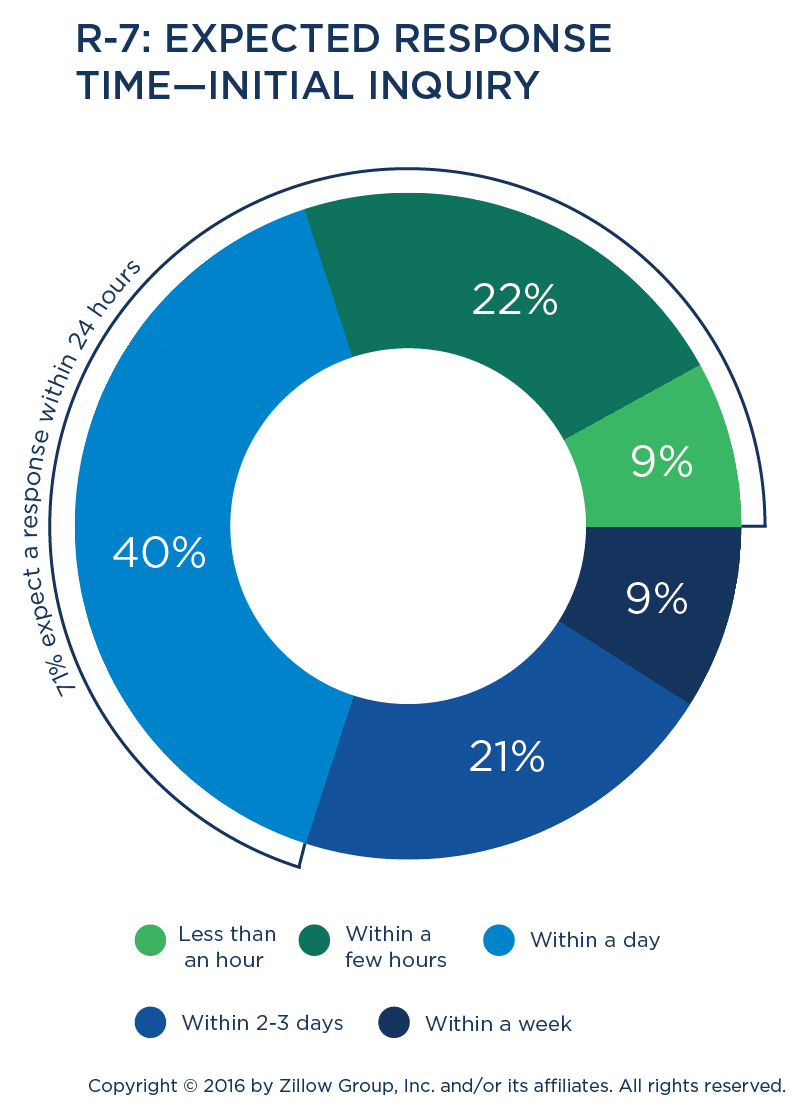
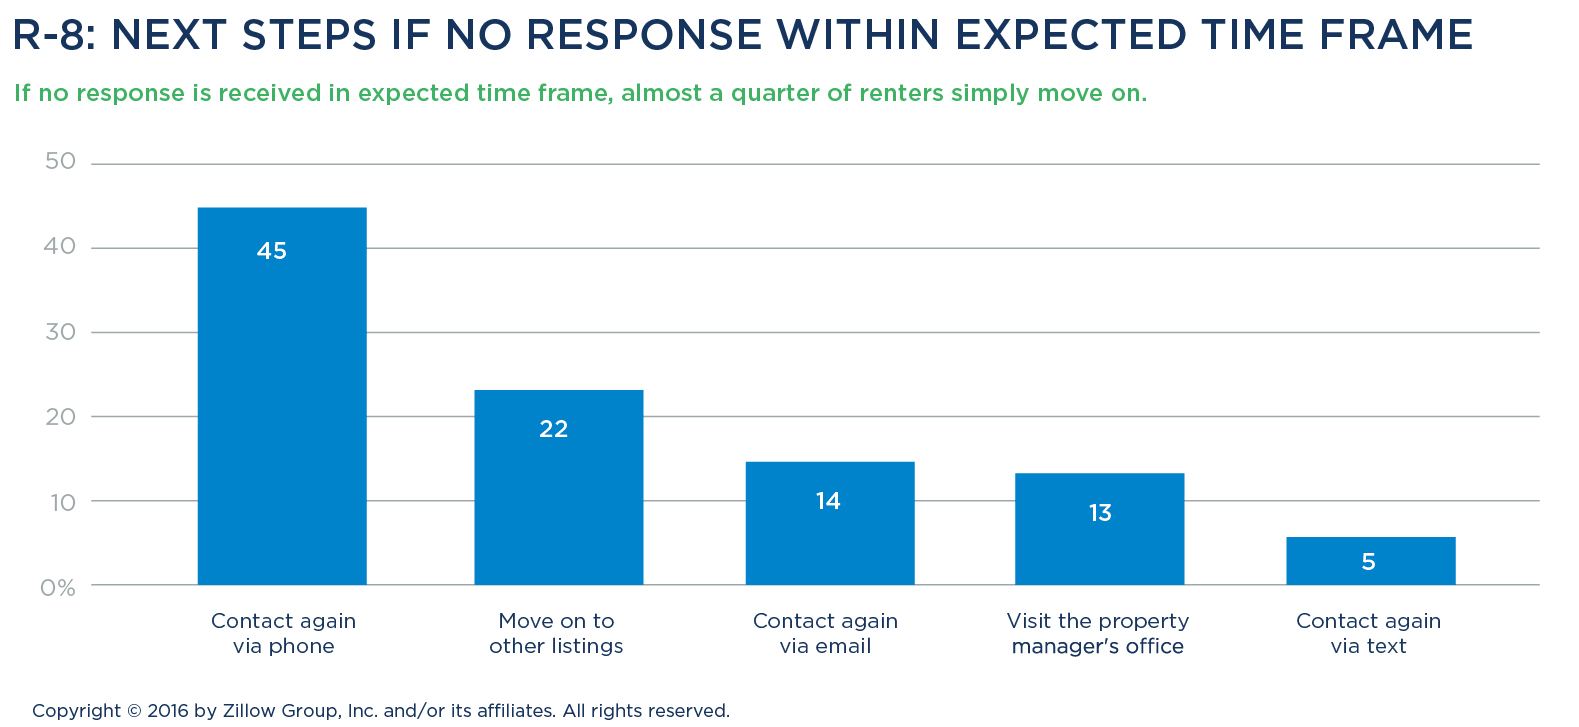


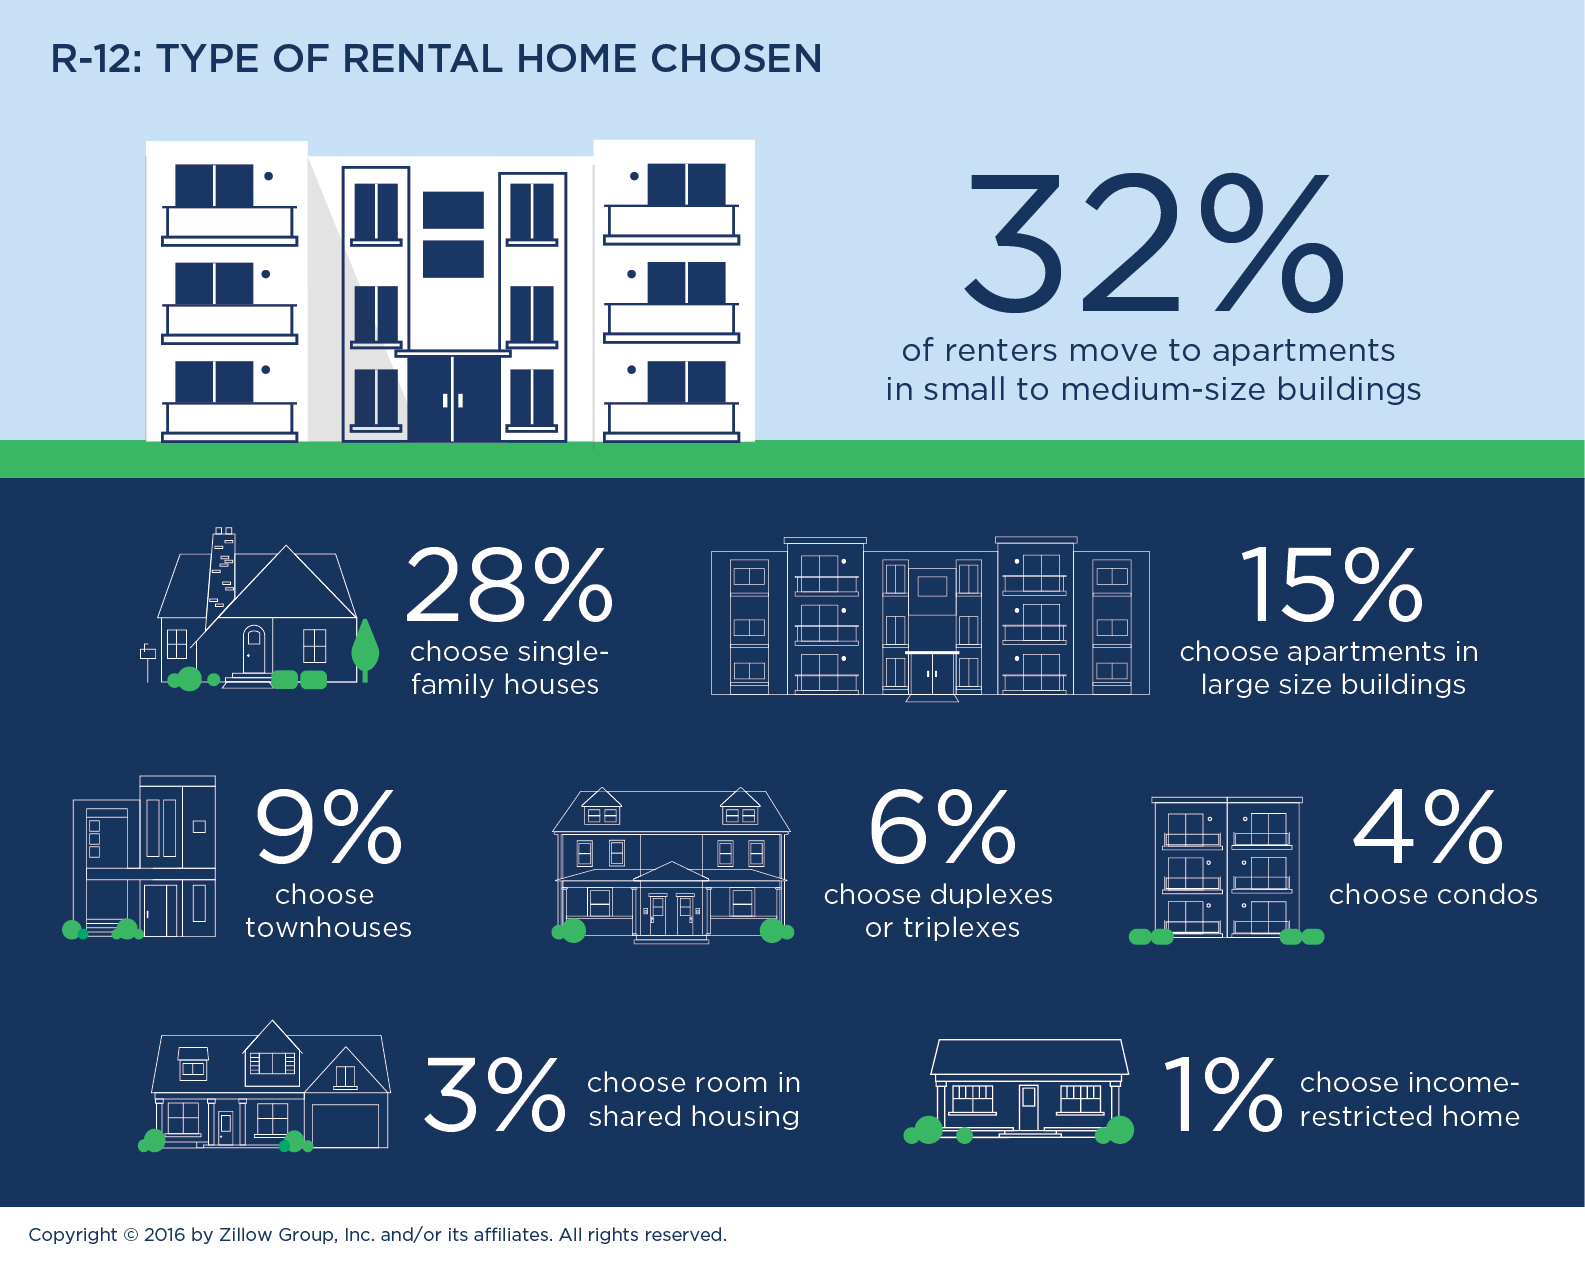

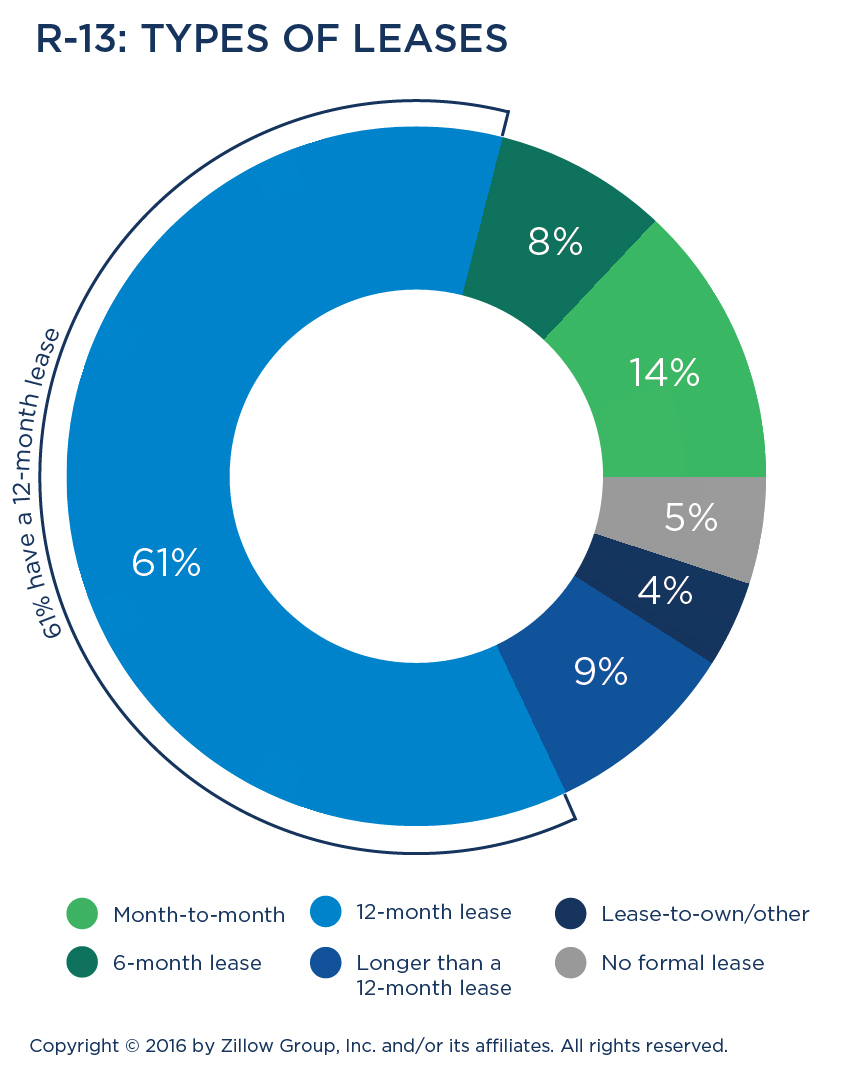
